Curated OER
Statistical Process Control
In this statistical process control worksheet, learners solve and complete 15 various types of problems. First, they estimate the standard deviation of the given process. Then, students use the target value as a center line and draw a...
Curated OER
Dragon Problem
For this probability worksheet, students calculate how many chops it would take to kill a dragon. They are given rules on what will and what will not kill the dragon and asked to collect their data showing which method they used to kill...
Curated OER
Data collection and analysis
In this probability and statistics worksheet, students determine when a survey or collected data could be biased. The one page worksheet contains a combination of three multiple choice and free response questions. Answers are included.
Curated OER
Analyze and Interpret Statistical Information
For this probability and statistics worksheet, 9th graders analyze and interpret histograms as they identify trends in the data. The two page worksheet contains four problems. Answers are provided.
Curated OER
The Volleyball Word Problem
For this probability and statistics worksheet, learners use the information from try-out activities to divided the players into fair teams. The two page worksheet contaijns one problems. Answers are not included.
EngageNY
End-of-Module Assessment Task: Grade 7 Mathematics Module 5
Show learners how to use simulations and random sampling to reach conclusions with the last resource in a 25-part series. The assessment contains three scenarios, each with several parts, and covers comparing populations using random...
Inside Mathematics
Suzi's Company
The mean might not always be the best representation of the average. The assessment task has individuals determine the measures of center for the salaries of a company. They determine which of the three would be the best representation...
Inside Mathematics
Archery
Put the better archer in a box. The performance task has pupils compare the performance of two archers using box-and-whisker plots. The resource includes sample responses that are useful in comparing individuals' work to others.
Curated OER
Counting Principle
In this probability and statistics worksheet, students work with a family member to determine the number of outcomes in a given situation. The two page worksheet contains four questions. Answers are included.
EngageNY
Population Problems
Find the percent of the population that meets the criteria. The 17th segment of a 20-part unit presents problems that involve percents of a population. Pupils use tape diagrams to create equations to find the percents of subgroups of the...
Noyce Foundation
Ducklings
The class gets their mean and median all in a row with an assessment task that uses a population of ducklings to work with data displays and measures of central tendency. Pupils create a frequency chart and calculate the mean and median....
Inside Mathematics
Snakes
Get a line on the snakes. The assessment task requires the class to determine the species of unknown snakes based upon collected data. Individuals analyze two scatter plots and determine the most likely species for five additional data...
Inside Mathematics
Scatter Diagram
It is positive that how one performs on the first test relates to their performance on the second test. The three-question assessment has class members read and analyze a scatter plot of test scores. They must determine whether...
Inside Mathematics
Population
Population density, it is not all that it is plotted to be. Pupils analyze a scatter plot of population versus area for some of the states in the US. The class members respond to eight questions about the graph, specific points and...
EngageNY
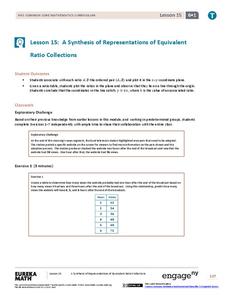
A Synthesis of Representations of Equivalent Ratio Collections
Make all the ratio representations fit together. The 15th segment in a series of 29 presents ratio problems to solve. Scholars use a variety of representations to respond to the questions. The problem set has pupils show how the...
EngageNY
Creating a Histogram
Display data over a larger interval. The fourth segment in a 22-part unit introduces histograms and plotting data within intervals to the class. Pupils create frequency tables with predefined intervals to build histograms. They describe...
EngageNY
Summarizing a Data Distribution by Describing Center, Variability, and Shape
Put those numbers to work by completing a statistical study! Pupils finish the last two steps in a statistical study by summarizing data with displays and numerical summaries. Individuals use the summaries to answer the statistical...
Inside Mathematics
Conference Tables
Pupils analyze a pattern of conference tables to determine the number of tables needed and the number of people that can be seated for a given size. Individuals develop general formulas for the two growing number patterns and use them to...
Inside Mathematics
House Prices
Mortgages, payments, and wages correlate with each other. The short assessment presents scatter plots for young mathematicians to interpret. Class members interpret the scatter plots of price versus payment and wage versus payment for...
Noyce Foundation
Baseball Players
Baseball is all about statistics. Pupils solve problems related to mean, median, and range. They calculate the total weight of players given the mean weight, calculate the mean weight of reserve players given the mean weight of the...
Curated OER
Graphing Activity
In this probability and statistics worksheet, students work with a family member to construct graphs based on real life data. The two page worksheet contains three questions. Answers are not included.
Curated OER
Compare and Order Length
Learners examine four objects and identify each as longer or shorter than their hand. They order the four objects from shortest to longest and respond to a test prep question. A good worksheet for in-class work, or for a homework...
Curated OER
Let's Play Ball
In this probability learning exercise, students read about a group of students who play six games of basketball and the results. Students solve 6 word problems about the basketball games.
Curated OER
Lucky Draw
In these probability worksheets, students cut apart series of letters in the words New Jersey, third graders, and mathematics. Students determine the probabilities for different questions about the words.
Other popular searches
- Fun Math Probability Games
- Probability/math Literature
- Smart Board Math Probability
- Grade 1 Math Probability
- Math Probability Vocabulary
- Math Probability Worksheets
- Sport Math Probability
- Math Probability Factorial
- Math Probability Games
- Grade 4 Math Probability
- Math Probability Lessons
- Probability and Sports Math


