Curated OER
Solving Problems and Puzzles
Review the 7's times tables how they relate to division, fractions, problems solving, and using a chart. Basic problem solving strategies are encouraged for each set of different problems.
Curated OER
Problem Solving and Puzzles: 3
Your class can use this to warm up or to discuss their problem solving strategies. They review the 8's times tables, relate the multiplication problems to division, then use a chart to solve a word problem involving money.
BW Walch
Solving Exponential Equations
Introducing exponential equations means learners need to take all the rules and tricks they learned for exponents and actually apply them. This presentation comes to the rescue by touching on changing bases in exponential...
Curated OER
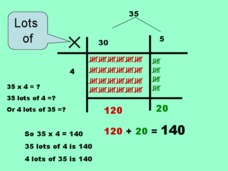
Grid: Multiplication and Tally Marks
I wouldn't say that making and counting tally marks is the best way to solve a multiplication problems, but this PowerPoint may prove me wrong. Kids solve double-digit multiplication problems using a simplistic grid and tally marks. They...
BW Walch
Creating Linear Inequalities in One Variable
Just when a young mathematician starts to feel comfortable turning word problems into linear equations, shake things up and throw inequalities in the mix. This excellent, instructive presentation takes the steps for solving an...
Curated OER
Timetable Problems
Learning how to read a schedule and determine when you will depart and arrive is an everyday skill that builds competency in chart reading, subtraction, elapsed time, and counting on. Learners discuss how to solve timetable problems and...
Curated OER
Unit 6b -Year 5
If you have some 9-10 year olds who are ready for some 5th year math, then check out this UK math unit. There are 172 slides that cover all of the basic multiplication tables, relate those to division, fractions, sequencing, and an...
Curated OER
Data Analysis: For Little Learners
Using pictographs, tally charts, and surveys, kids learn all about data analysis and collection. They make surveys, collect data, then construct pictographs and tally charts to organize their information.


