CCSS Math Activities
Social Security Trust Fund
Will Social Security still be around when you retire? Given data on the predicted balance of the social security fund over time, scholars plot the points on a coordinate grid and determine if a quadratic regression fits the data. They...
EngageNY
Modeling a Context from Data (part 2)
Forgive me, I regress. Building upon previous modeling activities, the class examines models using the regression function on a graphing calculator. They use the modeling process to interpret the context and to make predictions...
Virginia Department of Education
Logarithmic Modeling
Explore logarithms and logarithmic regression. Young mathematicians first learn about inverse functions and about the logarithm function family. They take their newfound knowledge to use logarithmic functions to model situations and...
Curated OER
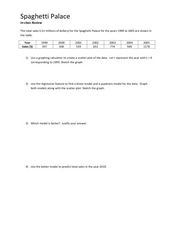
Spaghetti Palace
In this spaghetti palace worksheet sheet, students examine data and create a scatter plot. They use their graphing calculator to find a linear model and a quadratic model for given information. Students predict total...
Curated OER
Quadratic Applications
In this quadratic applications worksheet, students complete graphs, charts, comparison charts, and more having to do with quadratic equations. Students complete 5 different activities.
Balanced Assessment
Monitor Pricing
Out with the old and in with the new. Learners use a set of prices of computer monitors from 1994 to make a prediction. They then use one current price and what they know about the old prices to make a more recent prediction. Their...
Curated OER
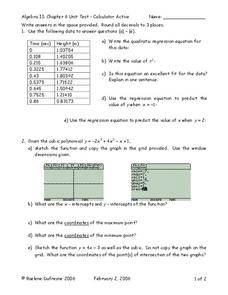
Polynomial Functions
In this Algebra II learning exercise, 11th graders use a graphing calculator to determine the regression equation of the given data, graph polynomial functions, factor polynomials, and determine the quotient and remainder in polynomial...
Virginia Department of Education
Curve of Best Fit
Which function models the data best? Pupils work through several activities to model data with a variety of functions. Individuals begin by reviewing the shapes of the functions and finding functions that will fit plotted data points. By...
Curated OER
Strike a Pose: Modeling in the Real World (There's Nothing to It!)
Adjust this lesson to fit either beginning or more advanced learners. Build a scatter plot, determine appropriate model (linear, quadratic, exponential), and then extend to evaluate the model with residuals. This problem uses real-world...


