EngageNY
Increasing and Decreasing Functions 1
Model situations with graphs. In the fourth installment of a 16-part module, scholars learn to qualitatively analyze graphs of piecewise linear functions in context. They learn to sketch graphs for different situations.
EngageNY
Increasing and Decreasing Functions 2
Explore linear and nonlinear models to help your class build their function skills. In a continuation of the previous lesson, learners continue to analyze and sketch functions that model real-world situations. They progress from linear...
Illustrative Mathematics
Velocity vs. Distance
At the end of this activity, your number crunchers will have a better understanding as to how to describe graphs of velocity versus time and distance versus time. It is easy for learners to misinterpret graphs of velocity, so have them...
Illustrative Mathematics
Riding by the Library
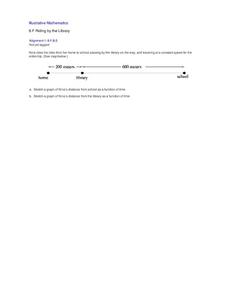
Draw a graph that shows the qualitative features of a function that has been described verbally. Make sure learners understand where time is zero and the distance is zero. It may take them some time to understand this concept, so working...
Space Awareness
Oceans on the Rise
Temperature rises and land disappears! Through a lab exploration, learners understand the effect of temperature increase on water similar to the effect of global warming on our oceans. As they heat the water in a flask, they measure the...
Curated OER
Cylinders and Scale
Students review what a cylinder is and how a cylinder is measured. They build a variety of cylinders with different heights and radii. They compare the surface area and volume of each cylinder and discuss anything that surprises them...
Curated OER
Sea Ice: Unscrambling the Egg Code
Students determine sea ice thickness, concentration, and floe size by reading egg codes. In this sea ice conditions lesson, students color code a map based on prescribed criteria and use the maps to identify changes in sea ice...
C-SPAN
Polling and Public Opinion
Most people are eager to offer their opinions about topics of interest, but what's the most effective way to collect and assess these opinions as a matter of fact? High schoolers learn about the history of polling, as well as the...
Curated OER
Exploring Trigonometric Functions
High schoolers are introduced to the characteristics of trigonometric functions. In groups, they analyze graphs of sine and cosine to determine the lengths of a triangle. They compare and contrast the graphical and numerical...
Curated OER
Pulse
Pupils determine a baseline pulse rate then chart the changes in rate with exercise. They describe the changes and develop a rationale for their observations. The task assesses students' abilities to make simple observations, determine...
Curated OER
Exploring the Landscape
Young scholars determine the monotonicity and concavity properties of a function, then apply the First Derivative Test and draw conclusions about the first and second derivatives from these properties.
Curated OER
Layering the Air
Students study the layer of the atmosphere. In this instructional activity on the atmosphere, students discuss the composition of the air around us and how the atmosphere was formed. Students create a scale model of the layers of the...


