Curated OER
Piecewise Linear Integral
Young mathematicians solve and graph piecewise functions in this calculus activity. They integrate linear functions containing restrictions and graph their answers using the TI.
Curated OER
Plotting Temperature and Altitude
students convert the temperature readings from degrees Celsius to degrees Fahrenheit. they predict and create a graph of what the graph of altitude (x-axis) versus temperature in degrees Fahrenheit (y-axis) might look like.
Curated OER
A Steep Hike
Learners explore slope. In this middle school mathematics lesson, students analyze and interpret graphs as they investigate slope as a rate of change. Learners use a motion detector to collect data as they walk at different...
Curated OER
Pancakes, Anyone?
First graders explore data collecting and graphing. In this data collecting and graping lesson, 1st graders watch a video about monster who sells pancakes. Students make a graph to record the most popular pancake. Students also play...
Curated OER
Slopes of Lines
Students examine a graph and relate it to the real world situation it depicts. They investigate changes in an equation and the appearance of a line. They investigate the connection between the graph of a situation and the meaning of the...
Curated OER
Download and Analyze
Students download information from a NASA website into a database. They transfer it to a spreadsheet by completing the information and analyze the information. They determine temperature averages, mode, and graph the results. They write...
Curated OER
Gravity, Angles, and Measurement
Learners relate math to real life scenarios. For this geometry lesson, students launch a ball tracking each launch using a graph. They analyze their data for speed, angles and distance, trying to improve on each launch.
Curated OER
Why Would I Owe My Soul to the Company Store?
Sixth graders listen to "Sixteen Tons" by Tennessee Ernie Ford and discuss what it means to owe one's soul to a store. In this mathematics lesson, 6th graders determine what a miner's income was minus his expenses graphing findings in a...
Curated OER
Which Car Should I Buy?
Students use gas mileage of different cars to create T charts, algebraic equations, and graphs to show which gets better mileage. In this gas mileage lesson plan, students use the graph to see which car they should buy.
Curated OER
French Fry Fun: Estimating and Measuring
Third graders demonstrate their estimating and measuring abilities. In this length measurement lesson, 3rd graders produce estimates of how long a handful of French fries will be before physically measuring them. Students...
Curated OER
You Sank My Battleship
Young scholars apply the concept of transformation to the game of battleship. In this algebra lesson, students relate their linear equations to how they would graph or set up their game pieces to win.
Curated OER
What is Log?
Young mathematicians differentiate between logs and natural logs in this algebra lesson. They solve functions and logarithmic functions. Learners also graph and rewrite the exponential and log functions.
Curated OER
How Long? How Wide?
Second graders distinguish between and use nonstandard and standard units of measurement, use appropriate tools and techniques to measure length and width, and record and interpret data using graphs.
Curated OER
Scatter Plots
In this Algebra I/Geometry/Algebra II worksheet, students create a scatter plot and analyze the data to determine if the data show any type of correlation. The four page worksheet provides extensive explanation of topic,...
Curated OER
Domain and Range
Your class will grasp the concept of domain-and range on a graph by using their TI navigator to graph their lines. They observe the effect of a function and non-functions based on the domain and range.
Curated OER
Conduction, Convection, Radiation, Oh My!
Middle schoolers draw a line graph, and use graphing as a tool to discover more about conduction, convection and radiation. They should design their own experiment using heat sensitive paper to show they explain these 3 processes.
Curated OER
Do the Elephants Need Sunscreen? A Study of the Weather Patterns in Etosha
Students analyze the weather patterns in Namibia. They create a graph of the yearly temperatures and use the internet to gather information. They discuss how the weather goes in cycles in the area.
Curated OER
Eatem Up!
Students identify, interpret and demonstrate a positive learning attitude. They identify, comprehend and use basic concepts and skills and then, communicate clearly in oral, artistic, written, and nonverbal form. Students also identify...
Curated OER
A Day to Remember!
Students study math. In this real-life problem solving lesson, students work on their skills dealing with time and money. They work in small groups on various time and money word problems and by the final day they have a final problem...
Curated OER
Introduction to Mathematical Modeling
For this mathematical modeling worksheet, students answer two essay questions. They describe Newton's Law of Cooling by describing and constructing a model and answering seven essay questions about the process.
Curated OER
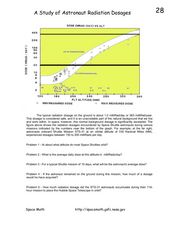
A Study of Astronaut Radiation Dosages
In this astronauts and radiation worksheet, students use a graph that shows the altitude of an astronaut versus the exposure to radiation to solve 5 problems. Students interpret the graph to express the amount of radiation at varying...
Curated OER
Burger King Investigation
Students study data on the nutritional value of Burger King meals in order to discover its nutritional value and also to compare the meals, using mathematical computation, to the recommended daily diet. In this data handling...
Curated OER
Jelly Bean's Galore
Students investigate the origins of the Jelly Bean. They complete a Scavenger Hunt using the jellybean website. Pupils create a bar graph using information collected about jelly beans. Students discuss the time of year that Jelly Beans...
Curated OER
Inequalities and Measures of Central Tendency
In this inequality and measures of central tendency worksheet, students solve and graph linear inequalities. They organize given data to identify the mean, mode and range. Students interpret box-and-whisker plots. This three-page...


