Hi, what do you want to do?
Curated OER
Opening a Restaurant
Students design a survey of the public as to what type of food should be served in restaurant that they are "planning" to open.
Curated OER
Follow a Bill!
Students participate in an activity to discover how a bill becomes law in California. In groups, they create a school program based on their own ideas for change. They develop and conduct a survey within their community and present their...
Curated OER
Getting to the Bottom of the Pyramids
Young scholars work together to develop logical arguments about pyramids and chain letters. They share their ideas with other groups and create a diagram showing the breakdown. They discuss the results.
Curated OER
Statistics: Final Exam Review
In this statistics and probability worksheet, students are provided with a review of the final exam in statistics. The three page worksheet contains a combination of six multiple choice and free response questions. Answers...
Curated OER
A Pocketful of Change
Students study the meaning, symbolism, and value of U.S. coins,
especially the quarter. They conduct a survey of coins in students'
possession, graphing the results to show frequency distribution and drawing
inferences about the U.S....
Curated OER
Statistical Analysis For Graphing Calculators
Learners analyze date from the Chesapeake Bay. Using a graphing calculator, they enter the data, plot three temperatures, and create a Box and Whisker plot.
Curated OER
Bioremediation
Learners design and conduct investigations that illustrate the effect bioremediation has on organic matter and determine environmental applications. They, in groups, present their findings to the class.
Curated OER
Mystery of the Malformed Frogs Lesson Plan
Young scholars develop an understanding of how students and volunteers can make scientific observations that can aid conservation. They read the account of the Minnesota New Country School project by Ryan Fisher, Mystery of the Malformed...
Curated OER
Money Circulation: A Story of Trade and Commerce
Students are introduced to the meaning, symbolism, and value of the quarter. They determine the percentage of total monetary value held in quarters and graph the results. Students infer about the U.S. Mint's distrubution of coins. They...
Curated OER
Making Sense of the Census
In this unit of lessons, students make sense of the census. They examine why a census is taken and partipate in activities.
Curated OER
Voting Adventure
Students discover the requirements they need to be able to vote in a democracy. Using that information, they discuss the importance of voting in an election. They use the Internet to analyze voter participation numbers in their county....
Science Buddies
Science Buddies: Estimation and Population Size
Have you ever wanted to take a short cut? How about when doing your math homework? In this experiment you can learn how estimation can save you time doing math calculations. But beware, some estimations are better than others. Can you...
Scholastic
Scholastic: Data Sampling
Data Sampling is a cutting-edge digital program designed to give young scholars multiple opportunities to dig deeply into the mathematics and real-world purposes of representative sampling.
Khan Academy
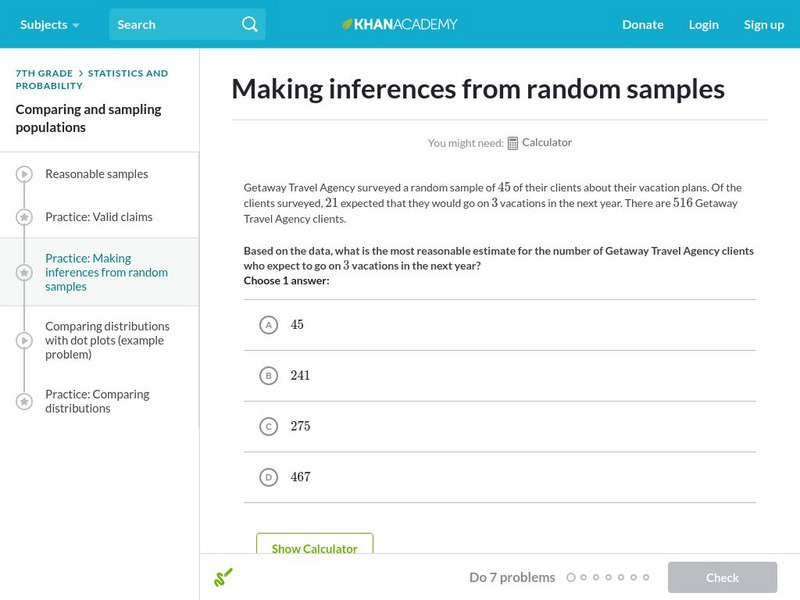
Khan Academy: Making Inferences From Random Samples
Practice making inferences from random samples.
Khan Academy
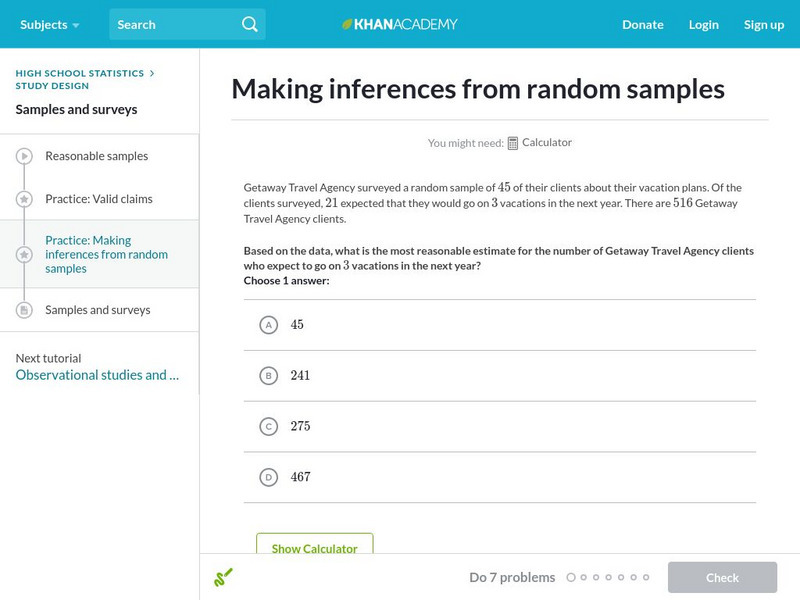
Khan Academy: Making Inferences From Random Samples
Given a random sample, practice figuring out what can we reasonably infer about the entire population? Students receive immediate feedback and have the opportunity to try questions repeatedly, watch a video or receive hints.
University of Georgia
University of Georgia: Inter Math: Sample
This site gives a description of a sample (of a population). The page offers information on various types of sampling. There are links to related terms, everyday examples, more information, and the interactive check point involving...
PBS
Pbs Learning Media: Estimation From Random Sampling
Practice estimating wildlife population by using the process of random sampling.
Khan Academy
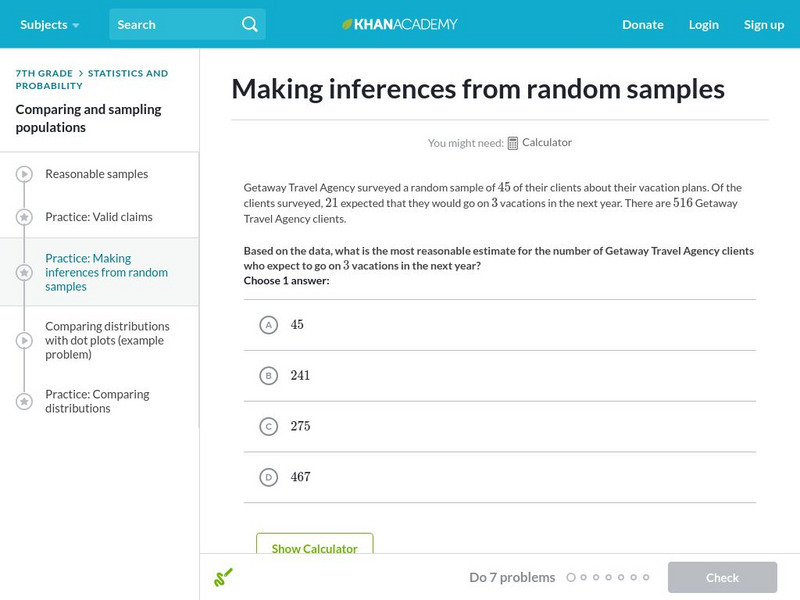
Khan Academy: Making Inferences From Random Samples
Practice making inferences from random samples.
Other
Nearpod: Random Sampling
In this lesson, 7th graders will learn how to use random sampling to make generatlizations and predictions about a population.
Alabama Learning Exchange
Alex: Something's Fishy: A Lesson in Biological Sampling
Determining the population in a larger area by tagging. By using proper scientific method and careful sampling procedures, students learn how biologists work in the field to collect data about a population. Students will also calculate...
CPALMS
Cpalms: Population of Utah
[Free Registration/Login Required] This is a formative assessment task where students are asked to estimate the population of Utah based on information given about its population density and the perimeter of its state boundaries. Samples...
National Council of Teachers of Mathematics
The Math Forum: Probability and Statistics
This page is a math home page that includes information on all topics of probability and statistics.
University of Cambridge
University of Cambridge: Maths and Sports: Who's the Best?
Can you use data from the 2008 Beijing Olympics medal tables to decide which country has the most naturally athletic population? This data-handling activity encourages mathematical investigation and discussion and is designed to be...


