EngageNY
Interpreting the Standard Deviation
Does standard deviation work for non-symmetrical distributions, and what does it mean? Through the use of examples, high schoolers determine the standard deviation of a variety of distributions and interpret its...
EngageNY
Analyzing Residuals (Part 1)
Just how far off is the least squares line? Using a graphing calculator, individuals or pairs create residual plots in order to determine how well a best fit line models data. Three examples walk through the calculator procedure of...
EngageNY
Analyzing Data Collected on Two Variables
Assign an interactive poster activity to assess your class's knowledge and skill concerning data analysis. The teacher reference provides solid questions to ask individuals or groups as they complete their posters.
EngageNY
Changing the Base
I can't calculate a base-2 logarithm since my calculator doesn't have a base-2 log key. Young mathematicians use the change of base formula to extend the properties of logarithms to all bases. Among these bases is the natural log base,...
EngageNY
Solving Equations Involving Linear Transformations of the Coordinate Space
Explore methods for solving linear systems with your classes and introduce learners to using matrices as a viable method. Scholars are able to recognize situations where matrices are the efficient method of solving. Application...
EngageNY
Making Fair Decisions
Life's not fair, but decisions can be. The 17th installment of a 21-part module teaches learners about fair decisions. They use simulations to develop strategies to make fair decisions.
Intel
Pedal Power
Show your classes the importance of mathematics in something as simple as bicycle design. The final lesson in the six-part STEM series has each group research a different aspect of the bicycle. Learners use mathematical formulas, linear...
NTTI
Transform Your Geometry into a Work of Art
Mathematicians utilize artwork to help illustrate the major ideas of transformations and tessellations. They visually identify transformations including reflections, rotations, and translations. They discuss how artists have used...
Curated OER
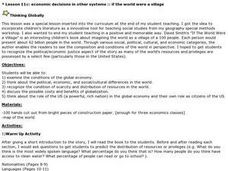
If the World Were a Village...
Your class members explore concept that the world is a large place, examine how statistics can be used to help in understanding the world and its people, and create illustrations or graphs of statistics found in the award-winning...
Curated OER
Can You Name That Shape?
Learners use materials to build, investigate, and draw two-dimensional shapes (polygons). They combine the shapes they have built and draw from the pile to begin a round-robin activity to name and determine the attributes of a selection...
Curated OER
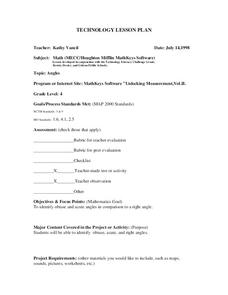
Angles
Learners identify obtuse and acute angles in comparsion to a right angle. They identify obtuse, acute, and right angles. Pupils use "Shape Measure" to construct obtuse, acute, and right angles. They review line segements to locate right...
Curated OER
Cross Cultural Transportation and Resources Exchange
Students examine various modes of transportation. They explore regional transportation options and discover options available in their area. Students survey types of transportation people use in their area. Using spreadsheet data,...
Curated OER
Budget Making
Students develop a budget for spending and saving. In this economics lesson, students create a budget based on personal, family and government income. They discuss jobs at home and allowances. They discuss how they manage their money...
Curated OER
Introduction to the National Debt
Learners relate the national debt to the economy. In this algebra lesson, students discuss what the national debt is, create a national budget based on priority and what the government should spend money on. They analyze their findings...
Texas Instruments
Finding Linear Models Part III
Explore linear functions! In this Algebra I lesson, mathematicians graph data in a scatter plot and use a graphing calculator to find a linear regression and/or a median-median line. They use the model to make predictions.
Curated OER
Visualizing Vectors
Investigate vectors in standard positions and use the CellSheet application on the TI calculator to find the sum of two vectors. Convert from polar to rectangular coordinates and vice versa, and show graphs of the vectors.
Curated OER
Influence and Outliers
Using the TI-Nspire calculator, statisicians identify outliers and their effect on the least-squares regression line. In finding the line of best fit, they determine what points will affect the least squares regressions and what points...
Curated OER
One-Variable Inequality Word Problems
Here is a great set of eight scenarios that require the writing of a one-variable inequality and then solving to find the solution. This inequality word problem activity is then followed by the solutions to each of the eight problems.
Bowland
Highway Link Design
Discover a renewed appreciation for the highway transportation department. with a lesson that has scholars design a highway route that meets certain conditions, including traffic flow, curves, speed limits, financial costs, and...
Curated OER
Charting History With Pennies
Students collect pennies and sort them in ascending order of dates. For the year on each penny, students research key events in history and pick a single event, explaining its historical significance. Then students use these events to...
Curated OER
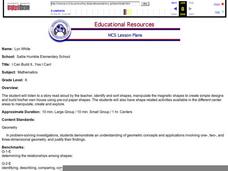
I Can Build It.....Yes I Can!
Kindergartners listen to a story read by their teacher, then use magnetic shape pieces to construct simple designes. They "build" their own house using pre-cut paper shapes. This age-appropriate lesson would be an excellent choice for...
Curated OER
The Luxor Hotel Contract
High schoolers determine the surface area of the Luxor Hotel, using the square feet of the base, volume, and the volume formula. They create a scale model of the triangular/pyramid shaped hotel.
Curated OER
Conditional Probability and Probability of Simultaneous Events
Your statisticians examine the characteristics of conditional probability and the probability of simultaneous independent events. They perform computer activities to find probabilities for simple compound events. They examine the...
Improving Measurement and Geometry in Elementary Schools
Rep Tiles
In addition to the catchy title, this lesson plan provides upper graders an opportunity to more closely scrutinize the attributes of plane figures. In particular, they focus on the similarity of different shapes. Both whole-class and...
Other popular searches
- Math Software Program
- Educational Software Math
- Life Skills Math Software
- Math Software Fractions
- Math Software Subtraction
- Division Math Software
- Tutorial Math Software
- Math Software Fahrenheit
- Math Software Dice


