American Institutes for Research
Digital Smiles
Explore metric measurement, recording data, and creating an electronic spreadsheet displaying results with your math class. Scholars will measure the length of their smiles, record the measurements, and represent the results on an...
Curated OER
Adding and Subtracting Decimals With Excel
What a great way to have pupils apply classroom learning to real-world skills! They complete problems involving the addition and subtraction of decimals related to banking-type questions, and then use a spreadsheet to display their results.
Curated OER
Data Analysis and Probability: Graphing Candy with Excel
Collect and graph data using Microsoft Excel with your math class. They will make predictions about the number of each colored candy in a bag of M&M's, then sort, classify, count, and record the actual data before using Excel to...
Curated OER
Discovering Pi
Define terminology related to a circle. Practice accuracy in measuring and then create a spreadsheet based on data collected from solving for parts of a circle. Groups can have fun analyzing their data as it relates to Pi.
Curated OER
How Credit Card Interest Works
Students experiment with an Excel spreadsheet model that demonstrates the effects of interest on payments. They calculate actual costs, interest paid, and time necessary to pay off credit purchases and draw conclusions about the...
Curated OER
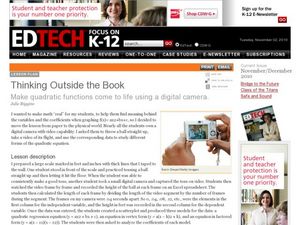
Thinking Outside the Box
Now this lesson sounds fun! Students throw a ball, film it as it soars through the air, and use a spreadsheet to collect data. A scatterplot is created to produce a quadratic regression equation, an equation in vertex form, and an...
Curated OER
Birds, Fractions and Percentages
Students study fractions, percentages, spreadsheets, and computers by watching and recording the number of species of birdsseen. They create a spreadsheet to record the results of their one month study.
Curated OER
Counting Coins
Second graders identify a quarter, dime, penny, nickel, and dime. They match the coin with it's monetary value, collect data on excel spreadsheet, and create a graph in Excel. Students participate in group activities.
Curated OER
Conversation Heart Graphing
Sixth graders review the different types of graphs (bar, line, pictograph) They predict the data set they can garner several boxes of conversation hearts. Students record their data using an Excel spreadsheet. They create a graph based...
Curated OER
Chances Are......You're Right
Young mathematicians study probability. In this math lesson, learners calculate odds, and convert those into percentages of probability. Fractions are also used, making this lesson quite rich in some of the more difficult conversions...
Curated OER
Build Your Dream Bedroom
Designers measure their own rooms and produce a scale drawing. They use the Internet to visit sites to find the costs of purchasing new carpet, paint, or anything else they would like to add to their room. Using a $1500 budget, they will...
Google
The Law of Large Numbers and Probability
Learners investigate why theoretical probability doesn't always match reality. The activity involves using Python 2.7 (or Sage) to set up a Bernoulli Trial. It also involves setting up a spreadsheet to simulate the Birthday Paradox....
Curated OER
Which Amusement Park Would You Choose?
Students analyze data related to amusement parks and create a spreadsheet to display the data. They read the data and predict which amusement park they think is safer, create a spreadsheet and graph, and write a proposal based on their...
Curated OER
Math Lesson: What Do You Want to Know? - Country Statistics
Learners are able to identify the characteristics of a variety of graphs (i.e. bar graph, line graph, pie graph, scatter plot, population pyramids, etc.) They recognize how the type of data to be presented plays a role in choosing the...
Curated OER
It's Your Life - Safe or Sorry/Safety Issues
Students examine and chart data about safety hazards and unsafe situations. For this safety hazard lesson, students examine newspapers and web sites to investigate injuries from safety hazards. They make a spreadsheet using the data and...
Curated OER
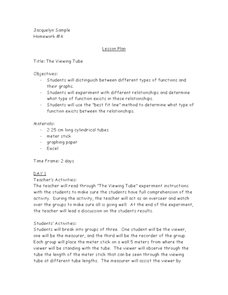
The Viewing Tube
Looking for an excellent instructional activity that incorporates math, science, and technology? Groups of three students use a viewing tube to perform an experiment, and discover how to organize their data into an Excel spreadsheet. ...
Kenan Fellows
Applying Linear Regression to Marathon Data
It's not a sprint, it's a marathon! Statistic concepts take time to develop and understand. A guided activity provides an opportunity for individuals to practice their linear regression techniques in spreadsheet software. The activity...
Curated OER
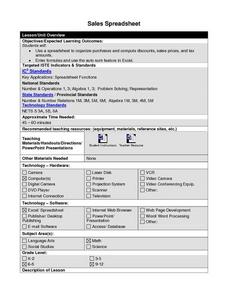
Sales Spreadsheet
Students use Excel spreadsheets to organize purchases, discounts, sales prices, and sales tax. Students follow step by step instructions and enter formulas as well as use the auto sum feature to calculate required calculations.
EngageNY
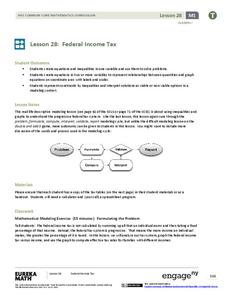
Federal Income Tax
Introduce your class to the federal tax system through an algebraic lens. This resource asks pupils to examine the variable structure of the tax system based on income. Young accountants use equations, expressions, and inequalities to...
Curated OER
Technobiz
Young scholars examine candy preferences to create a plan in order to improve candy sales. In this technobiz instructional activity, students build spreadsheet and organizational skills by graphing and calculating data. Young scholars...
EngageNY
More on Modeling Relationships with a Line
How do you create a residual plot? Work as a class and in small groups through the activity in order to learn how to build a residual plot. The activity builds upon previous learning on calculating residuals and serves as a precursor to...
EngageNY
Buying a Car
Future car owners use geometric sums to calculate payments for a car loan in the 31st installment of a 35-part module. These same concepts provide the basis for calculating annuity payments.
Federal Reserve Bank
Creating a Budget
Learning to create and maintain a budget is an important life skill. Guide individuals in the discovery of their spending habits and how to track them. They then use what they learned to create a budget and make decisions on where they...
Code.org
Making Data Visualizations
Relax ... now visualize the data. Introduce pupils to creating charts from a single data set. Using chart tools included in spreadsheet programs class members create data visualizations that display data. The activity encourages...


