Curated Video
Creating Stem-and-Leaf Plots: A Real-World Example
In this video, I will guide you through an explanation of a stem-and-leaf plot and give you a real world example to help you learn how to construct a stem-and-leaf plot. As a bonus, I will show you how to construct a stem-and-leaf plot...
Curated Video
What is a Stem and Leaf Plot?
In this video we will learn about Stem and Leaf Plots. We will learn how to read and interpret a stem and leaf plot. We will also learn how to identify how many data values are in the data set represented by the stem and leaf.
FuseSchool
MATHS - Statistics - Stem and Leaf Plots
A Stem and Leaf Plot is a way to display data. We always keep every item of raw data. The data is put into a table where each data value is split into a "stem" (the first digit or digits) and a "leaf" (usually the last digit).
Crash Course
Plots, Outliers, and Justin Timberlake Data Visualization Part 2 - Crash Course Statistics
Today we’re going to finish up our unit on data visualization by taking a closer look at how dot plots, box plots, and stem and leaf plots represent data. We’ll also talk about the rules we can use to identify outliers and apply our new...
Curated Video
Stem & Leaf Plots | Probability | Maths | FuseSchool
CREDITS Animation & Design: Joshua Thomas Narration: Chloe Adams Script: Kath Hipkiss A Stem and Leaf Plot is a way to display data. We always keep every item of raw data. The data is put into a table where each data value is split into...
Tarver Academy
Stem and Leaf Plot
http://bit.ly/tarversub Subscribe to join the best students on the planet!! ----Have Instagram? DM me your math problems! http://bit.ly/tarvergram Hangout with Tyler and watch EXCLUSIVE videos!! http://patreon.com/tylertarver Get Math...
Anywhere Math
Stem-and-Leaf Plots
Keep the leaves on the stem for mathematical success. Using the lengths of telephone call data, an informative video goes through the steps to create a stem-and-leaf plot. The presenter shows how to read and interpret data in a...
Curated OER
How Do You Read a Stem and Leaf Plot?
Solidify your pupils' understanding of a stem and leaf plot using this film. In this video, an instructor demonstrates how to create this type of graph in a step-by-step process.
Corbett Maths
Reading Stem and Leaf Diagrams
What are you growing in your math classroom? Scholars use a video lesson to learn how to read a stem and leaf diagram. The video instructor explains how to interpret the key and then explores how to find the range, mode, and median from...
Mathed Up!
Stem and Leaf Diagrams
Order the data within a stem-and-leaf display. Pupils take data and create and ordered stem-and-leaf diagrams, including the key. Participants take their data and determine answers about the information. Class members then find...
Corbett Maths
Drawing Stem and Leaf Diagrams
Plant the seed and watch it grow! A video lesson teaches learners how to create a stem-and-leaf diagram from a set of data. The instructor discusses the purpose and advantages of organizing data with the diagrams.
Crash Course
Plots, Outliers, and Justin Timberlake - Data Visualization Part 2: Crash Course Statistics #6
How many ways can you visualize data? An informative video showcases data representations, with specific attention to stem-and-leaf plots and box plots. Viewers also learn to identify and interpret outliers in data.
Curated OER
What is Numerical, or Quantitative, Data?
The teacher gives a very thorough explanation of numerical or quantitative data being anything where the answer to a question would be a number. Whereas any other answer might be considered categorical. She shows several different ways...
Khan Academy
Box-and-Whisker Plots
Elucidating the concept of box-and-whisker plots, Sal explains not only how to generate the diagram but also how to read one. He uses several examples to help young mathematicians become familiar with the format and explains its...
Curated OER
What is Numerical, or Quantitative, Data?
The teacher gives a very thorough explanation of numerical or quantitative data being anything where the answer to a question would be a number. Whereas any other answer might be considered categorical. She shows several different ways...
Scholastic
Study Jams! Choosing the Correct Graph
With so many types of graphs, don't let your learners get stuck figuring out which one to use. To track how Zoe spent her allowance, use this interactive lesson to review all the types of graphs and pick the best one to display the data....
Khan Academy
Khan Academy: Algebra: Stem and Leaf Plots
Video gives example of creating stem-and-leaf plots for data. Includes link to additional problems. [6:45]
Virtual Nerd
Virtual Nerd: What Is a Stem and Leaf Plot?
A Stem-and-Leaf plot is a type of graph in which data values are split into stems and leaves. This video will show you how to use these graphs, and show you how they can be used for practical purposes. [7:41]
Khan Academy
Khan Academy: Statistics: Stem and Leaf Plots
Video demonstration of reading a stem-and-leaf plot and using it to answer a question. Includes link to practice problems. [5:58]
Math Mammoth
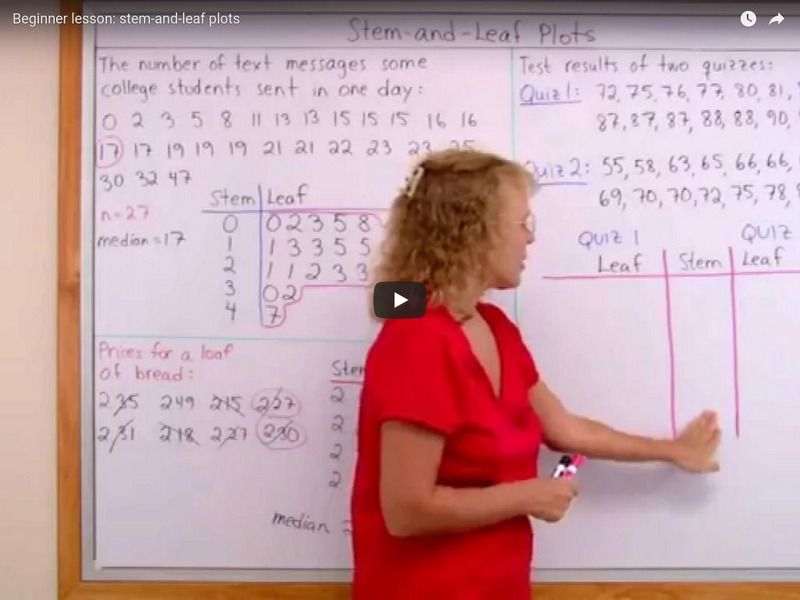
Math Mammoth: Beginner Lesson: Stem and Leaf Plots
Demonstrates how to make stem-and-leaf plots, what the median is, and how to observe the distribution of the data. [9:57]
Loyola University Chicago
Math Flix: Graphs: Stem and Leaf Plots
This QuickTime movie provides an opportunity to create a stem and leaf plot. A pdf worksheet is available by clicking on the hyperlink at the bottom of the page. As you watch and listen to the teacher and student interact it helps...
Loyola University Chicago
Math Flix: Graphs: Stem and Leaf Problem
This QuickTime movie provides an opportunity to solve a stem and leaf plot problem. As you watch and listen to the teacher and student interact it helps clarify the thinking behind applying this concept.


