Math Worksheets Land
Patterns of Association (Using Data Tables) - Guided Lesson
The worksheet belongs to a four-part resource that applies percentages to data tables. The page has three practice problems that continues with the development of this topic.
Math Worksheets Land
Patterns of Association (Using Data Table) - Matching Worksheet
This resource is the last of a four-part series that practices calculating percents based on data represetned in tables. This page has four multiple choice problems that analyze the data tables to answer a question.
Balanced Assessment
Sales Tax Table
Sales tax rates vary; do the math to find the right rate! Pupils use before tax amounts and after tax amounts to determine the tax rate. Rounding makes the task challenging.
Illustrative Mathematics
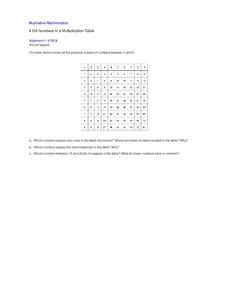
Numbers in a Multiplication Table
Identifying patterns is a crucial skill for all mathematicians, young and old. Explore the multiplication table with your class, using patterns and symmetry to teach about square numbers, prime numbers, and the commutative and identity...
Curated OER
Patterns in the Multiplication Table
Explore patterns in the multiplication table in order to deepen your third graders' understanding of this essential skill. Implement this activity as a whole-class lesson, allowing students to work in pairs or small groups to support...
CPM
How to Recognize the Type of Graph from a Table
Linear, quadratic, and exponential functions are represented only by their table of values in this simple, well-written worksheet. Learners decide the type of graph represented based on the differences in the function values....
Math Drills
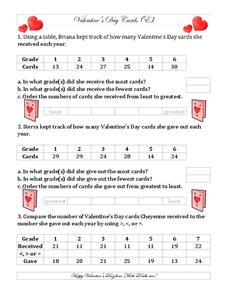
Valentine's Day Ordering and Comparing (E)
Love is in the air, and in a math table! Young learners chart the number of cards from each grade from least to greatest in three Valentine's Day word problems.
EngageNY
Summarizing Bivariate Categorical Data with Relative Frequencies
It is hard to determine whether there is a relationship with the categorical data, because the numbers are so different. Working with a familiar two-way table on super powers, the class determines relative frequencies for each...
EngageNY
Summarizing Bivariate Categorical Data
How do you summarize data that cannot be averaged? Using an exploratory method, learners complete a two-way frequency table on super powers. The subject matter builds upon 8th grade knowledge of two-way tables.
Curated OER
Math Detective: Rounding Four Digit Numbers
In this rounding four-digit numbers instructional activity, students read the multi-step story problem, complete the table and write an explanation of their answer.
EngageNY
From Ratio Tables, Equations and Double Number Line Diagrams to Plots on the Coordinate Plane
Represent ratios using a variety of methods. Classmates combine the representations of ratios previously learned with the coordinate plane. Using ratio tables, equations, double number lines, and ordered pairs to represent...
PBS
Real-Life Math — Production Scheduler
Use unit rates to find the number of parts needed to produce a given number of units. A production scheduler shares the different ways schedulers use math to ensure the required amount of parts are available to manufacture air...
PBS
Math with Jake: Frequencies and Pitch
Be an octave above the rest. A musician explains how to write music in different time signatures. An interesting resource continues to demonstrate ratios using the pitch of musical notes and hertz. Pupils use a pitch table and determine...
Curated OER
Integrated Algebra Practice: Frequency Histograms, Bar Graphs and Tables
In this graphs worksheet, students solve 4 problems about histograms, bar graphs, and tables. Students answer questions about histograms, bar graphs, and tables.
Curated OER
Frequency, Histograms, Bar Graphs and Tables
In this frequency worksheet, students interpret histograms, bar graphs and tables. They examine frequency charts and comparison line graphs. This three-page worksheet contains 4 problems. Answers are provided on the...
EngageNY
Describing a Distribution Displayed in a Histogram
The shape of the histogram is also relative. Learners calculate relative frequencies from frequency tables and create relative frequency histograms. The scholars compare the histograms made from frequencies to those made from relative...
EngageNY
Creating a Dot Plot
Which dot am I? Pupils create dot plots to represent sample data through the use of frequency tables. The third segment in a series of 22 asks individuals to analyze the dot plots they created. The scholars translate back and...
Noyce Foundation
Ducklings
The class gets their mean and median all in a row with an assessment task that uses a population of ducklings to work with data displays and measures of central tendency. Pupils create a frequency chart and calculate the mean and median....
Math Drills
Valentine's Day Ordering and Comparing (B)
Discover this Valentine's Day-themed worksheet where young mathematicians answer word problems using data tables.
Math Drills
Valentine's Day Ordering and Comparing (A)
Youngsters use a data table to answer questions, in a Valentine's Day-themed learning exercise.
Math Worksheets Land
Patterns of Association (Using Data Tables) - Independent Practice Worksheet
Here is a worksheet that belongs in a four-part resource that has learners practice using data tables to calculate percentages. The page has ten problems with different data tables asking to find different...
Curated OER
Frequency Tables - Home Link Support
In this home school support worksheet, 2nd graders, with a home support person, review the use of frequency tables to organize and display data. They make their own frequency table and read it with the support person.
Curated OER
Make a Frequency Table and a Histogram for a Given Set of Data
In this data recording and data organization worksheet, students create one frequency table and one histogram for a given list of data. Explanations and examples for frequency tables and histograms are given.
Math Worksheets Land
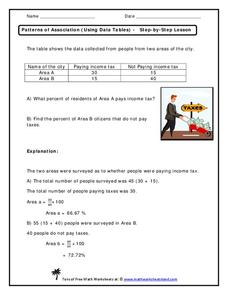
Patterns of Association (Using Data Tables) - Step-by-Step Lesson
This worksheet belongs to a four-part resource that gathers information from data tables to calculate percentages. The page introduces one problem and shares an explanation to the answer.
Other popular searches
- Math Tables and Tools
- +Math Tables Tips Tools
- Math Tables Tips Tools
- Math Tables and Graphs
- Making Math Tables
- Input/output Tables Math
- Learning Math Tables
- Math Tables Multiplacation
- Math Tables Multiplication
- Math Tables 3rd Grade
- Math Tables Predict
- Math Tables and Patterns


