Curated OER
Tables & Data
For this problem solving worksheet, 4th graders study the data found on a table involving the number of cans collected during a fund-raiser. Students utilize the concepts of addition and subtraction to solve 8 sentence word problems.
Curated OER
Using Tables
In this math worksheet, students use the information in the table to answer the following eight questions. Worksheet is about the different types of leaves.
Curated OER
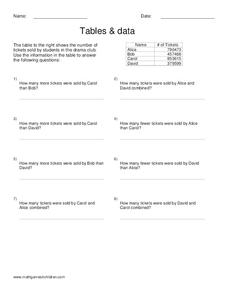
Tables & Data
In this problem solving learning exercise, 4th graders analyze a table involving how many tickets were sold by 4 students. Students utilize the concepts of addition and subtraction to solve 8 sentence word problems.
Curated OER
Tables and Data
In this data analysis worksheet, 3rd graders answer eight short answer questions based on the information on the table. Students use the data from the table to answer the questions.
Curated OER
Problem-Solving Strategy: Make a Table - Reteach
In this math tables worksheet, students read the word problem to understand the information. Kids then picture the information in the table. Students use the table to help them solve the problem. Students then make a table to help them...
Curated OER
Use a Table: Problem Solving
In this math tables activity, students read the math word problem and use the information from the math table with the votes for the club trip. Students then complete the problem solving method for the table for understand, plan, solve,...
Curated OER
Problem Solving Use a Table: Practice
In this math tables activity, students use a table to solve the word problems. Students determine which operation to use to solve the problem, draw a table to help them solve it, and then solve the problem.
Curated OER
Math Worksheet: Partially Filled Multiplication Table
In this multiplication worksheet, students fill in 50 blank spaces in a partially filled multiplication table with facts from 1 to 10. This is an interactive online worksheet that can be printed.
Curated OER
Caley Table for the Symmetries of a Square
Middle and high schoolers complete Caley's table to indicate rotating a square 90, 180, and 270 degrees. They also reflect a square across the vertical and horizontal line. This one-page worksheet contains eight movements.
Curated OER
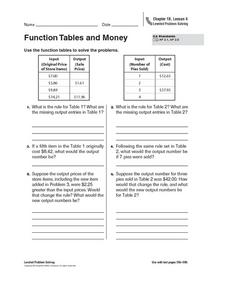
Function Tables and Money
In this function tables, money instructional activity, students examine 2 different function tables, where they are given input information. Students determine the rule of the function table, then calculate the missing output values. The...
Curated OER
Graphing From Function Tables
In this graphing from function tables instructional activity, students graph given functions from a completed function table. This is a instructional activity generator, the teacher can set the grid size for plotting points as well as...
Curated OER
Problem Solving: Use a Table Reteach 16.8
In this problem solving worksheet, learners learn to look for information in a data table. Students answer 6 questions about a data table.
Curated OER
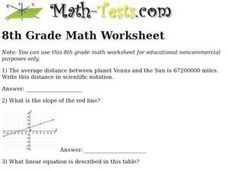
8th Grade Math Worksheet
In this linear equations learning exercise, 8th graders solve 10 different problems that include various types of linear equations. First, they write the distance between Venus and the Sun in scientific notation. Then, students determine...
Curated OER
Using the 10 Times Table
Dividing by 10 and multiplying by 10 is an integral skill for young scholars as they learn base-10 multiplication and division. First, they match five products to their equivalent equations, all of which include 10 as a factor. Next,...
Mathed Up!
Straight Line Graphs
Develop graphs by following the pattern. The resource provides opportunities for reviewing graphing linear equations. Pupils create tables to graph linear equations by using patterns whenever possible. The worksheet and video are part of...
Balanced Assessment
Scale Charts
Develop scales using tables. Pupils complete charts to show equivalent scale factors before using the completed tables to determine the sizes of scale drawings. They finish the lesson and demonstrate their understanding by completing a...
Mathed Up!
Drawing Quadratic Graphs
Curve through the points. The resource, created as a review for the General Certificate of Secondary Education Math test, gives scholars the opportunity to refresh their quadratic graphing skills. Pupils fill out function tables to...
Education Development Center
Creating a Polynomial Function to Fit a Table
Discover relationships between linear and nonlinear functions. Initially, a set of data seems linear, but upon further exploration, pupils realize the data can model an infinite number of functions. Scholars use multiple representations...
Curated OER
Word Problem Practice Workbook
Need worksheets that challenge your middle schoolers to apply their understanding of math? Problem solved! From integers, fractions, and percents, to algebra, geometry, and probability, over 100 pages of word problem worksheets...
Attainment Company
Money Skills
Young mathematicians learn to make sense out of money with this collection of skills practice worksheets. From identifying the different coins and bills in the US currency system, to counting money and correctly using the dollar and...
Curated OER
Sunshine Math 3
In this word problems instructional activity, learners read and problem solve nine mathematical word problems involving grids, measurement, compensation and angles.
National Council of Teachers of Mathematics
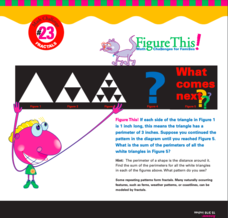
Math Challenge #23: Fractals
Young scholars explore the concepts of Sierpinski's triangle, ratios, and concentrations. For this exploratory lesson, students are given three problems to solve. Young scholars learn about Sierpinski's triangle, how to calculate mpg for...
Curated OER
K-5 Mathematics Module: Number and Number Sense
Reinforce number sense with a collection of math lessons for kindergarteners through fifth graders. Young mathematicians take part in hands-on activities, learning games, and complete skills-based worksheets to enhance proficiency...
University of Utah
Statistics-Investigate Patterns of Association in Bivariate Data
Young mathematicians construct and analyze patterns of association in bivariate data using scatter plots and linear models. The sixth chapter of a 10-part eighth grade workbook series then prompts class members to construct and...
Other popular searches
- Math Tables and Tools
- +Math Tables Tips Tools
- Math Tables Tips Tools
- Math Tables and Graphs
- Making Math Tables
- Input/output Tables Math
- Learning Math Tables
- Math Tables Multiplacation
- Math Tables Multiplication
- Math Tables 3rd Grade
- Math Tables Predict
- Math Tables and Patterns


