Curated OER
Tenths
For this fractions and decimals worksheet, students analyze a data table about painting playground fence posts. Students solve 6 story problems in which a fraction and a decimal are converted.
Curated OER
Statistics
In this statistics activity, students view 6 graphs to determine the correlation. Students then answer 4 questions that involve plotting data, determining a relationship, and making predictions.
Curated OER
Equation of a Line
In this equation of a line worksheet, 9th graders solve and complete 4 different multiple choice problems. First, they use the median fit method to determine the equation that most likely represents the line of best fit for the data...
Curated OER
Scatter Plots
In this scatter plots worksheet, learners solve and complete 4 different problems. First, they use the table shown to model the relation with a scatter plot and trend line and to predict the value of a variable when given the other...
Curated OER
Graph: Number of Laysan Albatross Nests and Chicks at Kilauea Point
In this bar graph instructional activity, students solve and complete 2 problems related to reading a bar graph. First, they use the data table found at the bottom of the sheet to complete the bar graph which illustrates the number of...
Curated OER
Bar Graphs 1
In this mathematics worksheet, 4th graders create a frequency table and a bar graph illustrating the results of the problem described. Then they find the average of the hours and favorite color for each word problem.
EngageNY
Markup and Markdown Problems
There is a 100 percent chance this resource will help pupils connect percents to financial literacy. Young mathematicians use their knowledge of percents to find markups and markdowns in financial situations in the seventh segment in a...
Curated OER
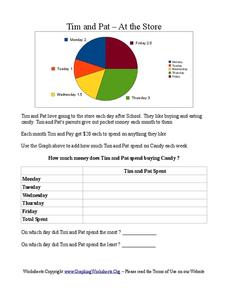
Tim and Pat - At the Store
In this pie chart worksheet, students use the pie chart to add the amount of time Tim and Pat spend buying candy each day of the week. Students answer 2 questions about the table.
Curated OER
Cindy and Linda - Selling Lemonade
In this pie charts worksheet, students use the pie chart to count how many glasses of Lemonade were sold by Cindy and Linda. Students complete the table and answer 3 questions.
Curated OER
Get a Half-Life!: Student Worksheet
In this math/science worksheet, students will work in pairs to conduct an experiment based on a decay function which is often used to model radioactive decay. Students will shake M & M's in a cup to rub off the M and then record...
Curated OER
Analyzing Data Sets
In this analyzing data sets instructional activity, 11th graders solve and complete 35 various types of problems that include the analysis of data given. First, they determine the equation that best describes the data shown in a table....
Curated OER
Spaghetti Bridges: Student Worksheet
In this math worksheet, students will create a "bridge" out of spaghetti and test it's strength with pennies. Students will record their results on a table and then graph the results.
Curated OER
Exercise Set 1.5: Inverse Functions
In this inverse functions worksheet, young scholars review inverse functions. They solve 66 questions. Problems cover a wide variety of types. Students graph functions and their inverses, they identify one-to-one functions and the...
Curated OER
Linear Equations
In this linear equations activity, 9th graders solve and complete 7 different problems that include a number of linear equations. First, they determine the slope given the points and then write an equation in slope-intercept form. Then,...
Curated OER
Cost analysis
In this Algebra I learning exercise, 9th graders analyze a problem in which basic assumptions must be made about cost and demand for the product or item. Students use a graph to make predictions and determine the best price at...
Curated OER
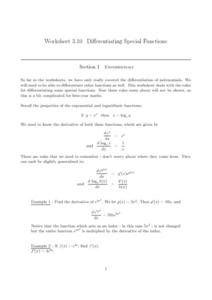
Differentiating Special Functions
In this differentiating special functions worksheet, students solve and complete 5 various types of problems. First, they differentiate each of the given functions. Then, students complete the table using a calculator and plot the points...
Curated OER
Stem and Leaf Plots
In this stem and leaf plots worksheet, students solve and complete 10 different problems that include designing stem and leaf plots. First, they use the table on the left to determine the least score and the range of the total scores...
Curated OER
Make Your Own
Your first and second graders will categorize hearts, triangles, and stars, putting them in a picture graph. After the shapes are organized, they compare the number of each using the sentence frames provided.
Curated OER
Linear and Exponential Models
Linear or exponential, see if your class can tell the difference. This very basic worksheet looks at different representations including tables of values, graphing, and an equation to assess understanding. This would make a good warm-up...
Illustrative Mathematics
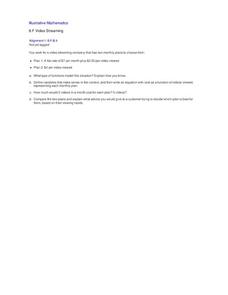
Video Streaming
Your movie fans will be interested in this resource. They will compare video streaming plans. One plan charges a set rate per month and a reduced viewing fee, and the other has a flat rate per each video viewed. Unfortunately, students...
West Contra Costa Unified School District
Talking About Distance, Rate and Time
Connect the tortoise and the hare fable to mathematics. Learners first identify key terms related to distance, rate, and time. They then solve distance/rate/time problems using different representations.
EngageNY
Distributions and Their Shapes
What can we find out about the data from the way it is shaped? Looking at displays that are familiar from previous grades, the class forms meaningful conjectures based upon the context of the data. The introductory lesson to...
EngageNY
Analyzing a Verbal Description
What function will describe the insect population growth? Pairs or small groups work together to determine which type of function and specific function will model given scenarios. The scenarios differentiate between linear,...
Yummy Math
Deflate-gate
Does temperature affect the air pressure of a football? Young mathematicians look at the readings from a pressure gauge and determine if the balls are within regulation or are under inflated.


