Illustrative Mathematics
Battery Charging
Your class will be very interested in the results of this activity. How long does it take a MP3 and video game player to charge? Sam only has an hour and the MP3 player only has 40% of its battery life left. Plus, his video player...
Concord Consortium
Center of Population
Let the resource take center stage in a lesson on population density. Scholars use provided historical data on the center of the US population to see how it shifted over time. They plot the data on a spreadsheet to look the speed of its...
Statistics Education Web
Are Female Hurricanes Deadlier than Male Hurricanes?
The battle of the sexes? Scholars first examine data on hurricane-related deaths and create graphical displays. They then use the data and displays to consider whether hurricanes with female names result in more deaths than hurricanes...
Curated OER
Data Handling
In this data handling worksheet, 6th graders solve and complete 4 various types of problems. First, they draw a bar chart to represent the information provided in the table shown. Then, students show beneath the table how to work out the...
Curated OER
Unit 11 - Worksheet 3 - Function
In this function worksheet, students observe graphs and determine whether the graph is a function based on a given table. They identify graphs of functions. This two-page worksheet contains 12 problems.
Curated OER
Maps and Lines
In these organizing data worksheets, 5th graders complete four worksheets of activities that help them learn maps, graphs, and lines. Students then study images of maps, lines, and graphs.
Curated OER
Statistical Inquiry
In this statistical inquiry worksheet, students analyze and interpret a variety of diagrams such as a scatter plot, bar graph and pie charts. They create tables and other diagrams to support given data. This two-page worksheet contains 3...
Curated OER
Pounds of Paper
In this collecting of data worksheet, 2nd graders study and analyze a pounds of paper table in order to solve and answer 6 mathematical questions.
Curated OER
Word Problems
In this word problem instructional activity, 6th graders solve 5 different word problems related to the data table shown. First, they determine the average of the overall scores as shown in the table and the mean of the overall scores....
Curated OER
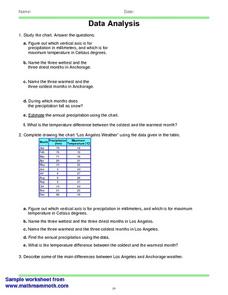
Data Analysis
In this data analysis worksheet, students solve and complete 4 different types of problems. First, they reduce the data provided to find the means, and graph the means in a line graph. Then, students graph the data from each mixture...
Math Worksheet Center
Linear Quadratic Systems
In this linear quadratic system worksheet, students explore a system with a linear and a quadratic equation. With the given equations, students graph the parabola. They identify the axis of symmetry, the slope, points of intersection,...
Curated OER
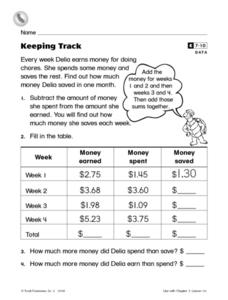
Keeping Track
For this data table worksheet, learners complete a table with information on money earned, spent and saved in each of 4 weeks for a student's job.
Curated OER
Smarties Investigation
In this math worksheet, learners complete a variety of activities using Smarties candy. For example, students estimate the number of each color, count the actual amount, and record their results in a tally chart.
Curated OER
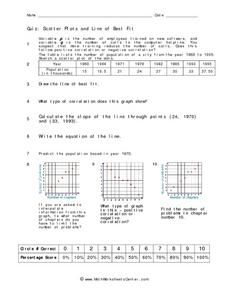
Quiz: Scatter Plots and Line of Best Fit
In this scatter plots and line of best fit worksheet, students create scatter plots from given sets of data. They answer questions concerning the scatter plot. Students write the equation of a line, identify the type of correlation...
Curated OER
Favourite Colours
For this colors worksheet, students survey 20 people on what their favorite color is. They mark the results using tallies. Students then take their data and put the totals in a frequency table.
Curated OER
Data Analysis 2
In this data analysis learning exercise, students read and interpret given line graphs. They determine the range and average. This one-page learning exercise contains five problems.
Curated OER
Proofs
For this proofs worksheet, 10th graders solve and graph 8 different equations. First, they prove that each triangle is either congruent or similar. Then, students use the concept of corresponding parts of congruent triangles to solve...
Curated OER
Recording Data From a Survey Reteaching Worksheet
In this recording data from a surveys reteaching worksheet, 2nd graders review the use of tallies when recording data. They use the information to make a data table and a bar graph that displays the information.
Curated OER
Interpreting a Pictogram
In this pictogram worksheet, students interpret a pictograph on ladybirds and answer 5 short answer questions or drawings referring back to the pictogram. Students carry out their own scenario pictogram and draw a table with their results.
Curated OER
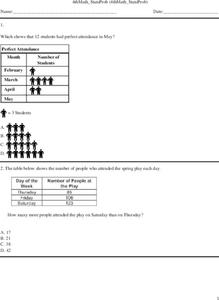
Fourth Grade Math Practice-Statistics
In this 4th grade statistics worksheet, students complete a total of 7 problems. An answer key is provided; problems are related to statistics.
Curated OER
Organizing and Interpreting Data
In this organizing and interpreting data worksheet, students solve and complete 10 different problems related to reading various data tables. First, they complete the 3 charts shown with the correct tally amount, frequency amount, and...
Curated OER
Data Handling: Pictogram of Birds
In this pictograph problem solving activity, students analyze a pictograph of birds seen each day for a week. They use the information on the graph to solve 6 problems.
Curated OER
Froot Loops to the Max - 1
Middle schoolers complete and solve five questions related to a box of Froot Loops cereal. First, they determine how many of each color of Froot Loops and which color has the greatest and least frequency. Then, pupils write the fraction...
Curated OER
Froot Loops to the Max - 2
In this Froot Loops to the max worksheet, students complete and solve 5 problems related to a box of Froot Loops cereal. First, they determine how many of each color is represented in the box of Froot Loops. Then, students determine...
