Curated OER
Hugs and Tallies
Students act out the creation of five tally marks. In this tally mark lesson, students act out how to make tally marks. Four students stand very close together and a fifth student gives them a group hug creating five tally marks.
Penn Museum
Ancient History Math Mystery
Through several organized and attractive worksheets, your learners will make a deduction about tally marks and hieroglyphics to determine what they represent in the ancient numeral system. This is a well-designed, interdisciplinary...
Curated OER
Tallies Tell It All
Students explore data collection through the use of tally marks. After a demonstration of the use of tally marks students complete various inquires where they create a chart documenting the number of times a desired result happens. They...
Curated OER
Valentine's Day Math
First graders sort their candy hearts into piles according to color and record a tally mark under the color for each candy heart that they have on the worksheet. They then record the total amount of tally marks for each color of candy...
Pennsylvania Department of Education
Freckle Face
Students collect and record data. For this early data analysis lesson, students gather data about their partners face. As a class, the students use tally marks and pictographs to record the data and answer question about the information...
Curated OER
Mathematics Lesson Plan
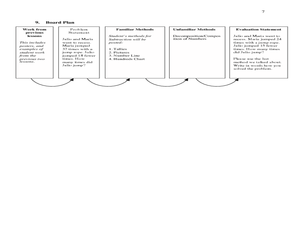
Second graders study subtraction facts. In this mathematics instructional activity, 2nd graders discuss how to solve two digit subtraction problems. Students recognize that there are many different methods or strategies one can use such...
Curated OER
Nutrition Lesson Plan
Second graders complete a survey as class answering the question: "Did you eat breakfast this morning?". They place a tally mark in the column that best represents their answer. They then discuss the results in the graph.
Curated OER
Bar Graphs with Tally Marks
Students classify buttons into categories, create and interpret a tally table and bar graph, and add and subtract numbers.
Curated OER
Going Graph-y
Second graders listen to and dicuss the story Where the Wild Things Are. They play a pantomime game and act out various feelings so their classmates can guess. They listen for the frequency of certain words, and record their findings on...
Curated OER
Tallying Animals
Second graders draw a picture of a pond scene which includes various animals. They exchange pictures and tally the number of animals drawn. Then they record the number on a chart and write a story about their pictures.
Curated OER
Survey and Tally
Second graders view a model of a survey and tally. In this survey and tally lesson, 2nd graders decide on questions for a survey. Students conduct the survey and tally their results. Students create a tally chart....
Curated OER
Organizing Data
Third graders investigate ways to organize data. In this tally marking lesson plan, 3rd graders practice drawing tally marks to represent an item of data. Students also make connections with skip counting by fives.
Curated OER
Tally Time
Learners create a tally chart. In this math and health instructional activity, students discuss healthy foods and create a tally chart showing the number of learners who like to eat healthy foods.
Curated OER
Where Do I Fit on the Graph?
Students collect data and create graphs about themselves, their community, and the world around them. They use a variety of methods to organize data, such as stickers, clothespins, name tags, coloring, tally marks, etc.
Curated OER
The Write Stuff
Fourth graders share a previously written portfolio piece and the class guesses the genre. Students use tally marks to keep track of how many of each piece there are in class. Once the data collection is complete, 4th graders create a...
Curated OER
Math on a Roll
Young scholars practice various math skills using a polyhedral die. In this dice game lesson, students practice multiplication, addition, place value, and money using games. Standard dice may be used instead of a polyhedral die with...
Curated OER
Many Ways to Represent Our Data
Demonstrate several ways to represent data with your class. They will use surveys to gather data and display the data using tally charts and graphs. Then answer questions according to the data.
Illustrative Mathematics
Comparing Numbers
Young mathematicians spin their way to a deeper number sense with this fun, collaborative activity. Using two spinners, one with the numbers 0-9 and the other with the decades 00-90, pairs of students take turns building and comparing...
Illustrative Mathematics
Find The Numbers 0-5 or 5-10
In need of math station or center for your kindergartners? Model how to play this game with the whole class first and then make it into a center. Create a few sets of six number cards with 0-5 or 5-10 and then create a matching die with...
Curated OER
Agriculture Counts
Students discuss the kinds of things they count and how to use tally marks. In this social science lesson, students count animal crackers by using tally marks for each kind of animal. The tally marks are changed into numbers and one...
Curated OER
Investigation - What Does 1,000 Look Like?
Second graders determine what 1,000 items look like. In this math investigation lesson, 2nd graders collect 1,000 items and determine the best way to count them by tens and hundreds. They can use stickers on notecards to count to 1,000....
Curated OER
Probabilities for Number Cubes
Learners explore the concept of probability. In this probability lesson, students roll a six-sided number cube and record the frequency of each outcome. Learners graph their data using a frequency chart and keep tally marks...
Curated OER
Oreo Math
In this Oreo math worksheet, students with a partner practice stacking Oreo cookies twice and predicting how many they can stack up before they fall.
Curated OER
Valentine's Day Math
First graders explore sorting and classifying. In this math lesson, 1st graders sort conversation hearts based on color. Students graph their results and enjoy the candy!


