EngageNY
Graphing the Sine and Cosine Functions
Doing is more effective than watching. Learners use spaghetti to discover the relationship between the unit circle and the graph of the sine and cosine functions. As they measure lengths on the unit circle and transfer them to a...
EngageNY
Why Do Banks Pay YOU to Provide Their Services?
How does a bank make money? That is the question at the based of a lesson that explores the methods banks use to calculate interest. Groups compare the linear simple interest pattern with the exponential compound interest pattern.
Alabama Learning Exchange
Sky High
How are skyscrapers built? What does it take to make a structurally sound building? How can one work within a budget to complete a building project? These guiding questions will be investigated and answered within a hands-on lesson....
Curated OER
Histograms
Young statisticians explore the concept of histograms. They construct histograms of various data such as change in a student's pocket, and guessing on a test. hHey analyze data represented as a histogram and a box plot and compare...
Curated OER
Linear Equations
Eighth and ninth graders solve and graph 42 different problems that include writing various equations and graphing them on a grid. First, they create a table for each equation and graph it on a grid locating the x-and y-intercepts. Then,...
West Contra Costa Unified School District
Indefinite Integrals
The inverse of matter is anti-matter, so the inverse of a derivative is an antiderivative. The lesson introduces antiderivatives and indefinite integrals to the class along with the notation for integrals. Groups work together to find...
Howard County Schools
Constant Rate Exploration
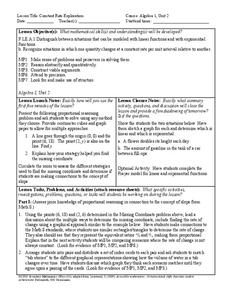
Question: What do rectangles and bathtub volume have in common? Answer: Linear equations. Learn how to identify situations that have constant rates by examining two different situations, one proportional and one not proportional.
Curated OER
How Much Will Movies Cost In The Future?
Young scholars use data collection and analysis, statistics, and probability in problem-solving situations and communicate the reasoning used in solving these problems.
Curated OER
Euler's Method
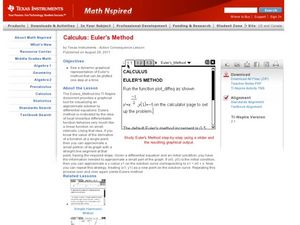
Learners identify Euler's method of graphing in this calculus lesson. They approximate values of a function and check their work using EM. They also differentiate equations at an exact point.
Curated OER
Proposed Problems
In this math worksheet, young scholars find the solutions to the problems that involve solving equations with and without rational expressions.
Curated OER
AP Calculus Practice Exam BC Version: Part B
In this calculus worksheet, students solve 17 multiple choice problems. Students find limits, summations, and derivatives of functions. Students find the area of an enclosed region between two curves.
Curated OER
Measuring a Mummy Case
Students calculate the size of a mummy case and its contents using ancient Egyptian measurements.
Curated OER
AP Calculus Practice Exam: BC Version - Part A
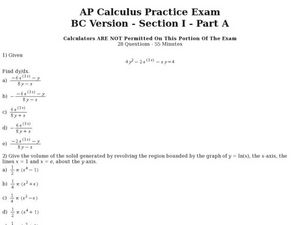
In this calculus worksheet, students solve 28 multiple choice problems. Students find derivatives, volumes, limits, convergent series, etc.
Curated OER
Calculus Practice BC
In this calculus worksheet, learners solve functions using the derivatives. They calculate the volume where the graph is revolving around the x-axis, a line, the y-axis and where x=e. There are 28 questions.
Curated OER
AP Calculus Practice Exam
In this calculus learning exercise, students solve functions by taking the derivative of the equations. There are 28 questions using logs and trig functions.
Curated OER
Piggy Pockets
Second graders determine when estimates and exact totals are appropriate in dealing with money. They simulate keeping a checking account over a period of time and keep a checkbook ledger to record deposits and expenses.
Curated OER
Hibernating Hoopla
Students simulate hibernation with their stuffed animals. They predict the length of time of hibernation and type their math journal entries about sorting, graphing and draw pictures. They read bear hibernation stories.
Curated OER
Perplexing Puzzles
Elementary and middle schoolers explore scatter plots. In this graphing lesson, pupils work in small groups and use jigsaw puzzles to develop a scatter plot. Younger students may develop a bar graph.
Curated OER
School Yard Waste
Fourth graders examine the types of garbage that they collect on the playground. They collect the information in a spreadsheet and create a graph that displays the number of types of trash found. They design and monitor a playground...
Curated OER
Body Balance
Examine measurable characteristics of objects to build an understanding of the different ways you can discuss an object's size when comparing it to other objects. After whole group instruction, the class compares and organizes several...
Illustrative Mathematics
Accuracy of Carbon 14 Dating I
Here is an activity that is intended to highlight a very important issue about precision in reporting and understanding statements in a realistic scientific context. Discuss different ways of reporting the half life of Carbon 14...
Curated OER
The Bank Account
Your algebra learners become bankers for a day as they explore compounding interest and the formula used to calculate the balance in a savings account. Questions guide the learners as they analyze the formula's parts and their connection...
Curated OER
Volume of Rectangular Prisms
Introduce the procedure needed to find the volume of a rectangular prism. Learners rank various prisms such as cereal boxes and tissue boxes from smallest to largest volume. They use an applet to find the volume and surface area of each...
Curated OER
Energy Conservation (Middle, Mathematics)
Learners take turns reading the electric meter six times a day at regularly scheduled intervals. They figure out the amount of electricity used and then determine the total cost of electricity for the week.


