Curated OER
Telling Time Worksheet: Draw Hands on the Clock
In this telling time activity, students look at the times stated underneath each of the 9 clocks and then draw clock hands on each clock to symbolize the correct time.
Curated OER
What Time Is It? #2
In this telling time worksheet, students look at a set of 9 clocks and write the correct time shown on each on a line beneath each clock.
Curated OER
Analog Clock Faces - Writing Digital Time
In this telling time worksheet, students read the 10 analog times shown on clocks and record them. The times are in 10 minute increments.
Curated OER
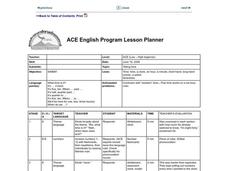
Telling Time
Students tell time. In this ELL vocabulary development and math lesson, students orally tell time to five minute intervals when shown a classroom clock. Students practice using number and "telling time" vocabulary in sentences and...
Charleston School District
Sketching a Piecewise Function
How do you combine linear and nonlinear functions? You piece them together! The lesson begins by analyzing given linear piecewise functions and then introduces nonlinear parts. Then the process is reversed to create graphs from given...
Inside Mathematics
Graphs (2007)
Challenge the class to utilize their knowledge of linear and quadratic functions to determine the intersection of the parent quadratic graph and linear proportional graphs. Using the pattern for the solutions, individuals develop a...
EngageNY
Decimal Expansions of Fractions, Part 2
Develop your pupils' understanding of fractions and their decimal equivalence using the 12th lesson in this series. Scholars learn an alternative to long division that results in converting fractions to decimals that emphasize fractional...
Inside Mathematics
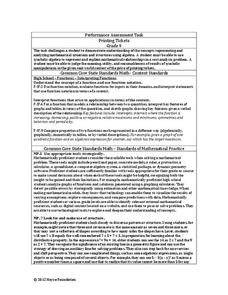
Printing Tickets
Determine the better deal. Pupils write the equation for the cost of printing tickets from different printers. They compare the costs graphically and algebraicaly to determine which printer has the best deal based upon the quantity of...
Virginia Department of Education
Functions 2
Demonstrate linear and quadratic functions through contextual modeling. Young mathematicians explore both types of functions by analyzing their key features. They then relate these key features to the contextual relationship the function...
CK-12 Foundation
Broken-Line Graphs: Heating Curve of Water
Examine the unique graphs coined broken-line graphs. Using the phase change of water for data, learners answer questions related to the temperature and energy at different times in the cycle of the phase change. Questions focus on the...
College Board
2009 AP® Statistics Free-Response Questions Form B
Is your class taking the AP® Statistics exam in the near future? You may want to take a look here. Using the 2009 AP® Statistics free-response questions Form B helps learners become familiar with the testing conditions, such as time...
Curated OER
Exploration 1: Instantaneous Rate of Change Function
In this function worksheet, students read word problems and write functions. They determine the instantaneous rate of change and identify intervals. This three-page worksheet contains approximately 20 problems.
Curated OER
Telling Time
In this telling time worksheet, students write the time down in five minute intervals as shown on the six clocks posted on the worksheet.
Curated OER
Alfy plays "Time Flies"
Third graders use the Internet to go to a math web site to explore, practice and play time telling exercises. They play a time game by moving the clock arms to match a time presented on a button.
Curated OER
Go Forward and Back With Time
In this time worksheet, students solve a set of 6 problems, telling what time it is from one time given to other intervals given.
Curated OER
Telling Time
In this telling time worksheet, students write the time on each of six clocks in words associated with half hour intervals. Students share their answers with their classmates.
Curated OER
Exploratory Problem: Cardiac Output Rates
In this rate problem, students explore the cardiac output of a patients heart by using the dye dilution method. They determine an interval of time and set up an integral to express the exact amount flow. This two-page activity contains...
Curated OER
Creating Line Graphs
Young scholars relate data to coordinate graphs and plot points on this graph. They use minimum wage data to construct the graph. Students decide appropriate time intervals for the graphs. They share graphs with their classmates.
Curated OER
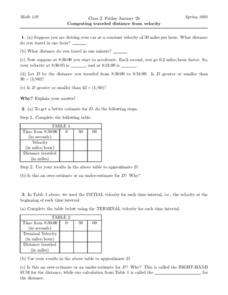
Computing Traveled Distance from Velocity
In this velocity worksheet, students compute the distance they would travel given a constant velocity for a car for specified amounts of time. They use tables to find the initial and terminal velocities for each time interval.
Curated OER
Half Hour Time
In this math worksheet, students fill in the time for half hour intervals. They use the pictures of clocks to fill in the hour and second hands.
Curated OER
Time: Quarter Hour
In this math literacy worksheet, students find the right times for the fifteen minute intervals. They fill in the times for the clocks with the hour and minute hands.
Curated OER
Team Up for Telling Time
Students team up to compete in a variety of Internet time-telling activities. In teams of four, groups are assigned to computers and solve problems related to telling time.
Curated OER
Telling Time
Students practice telling time using five and ten minutes intervals. They use their arms and bodies to show the time while following teacher led instructions. They go through the motions as a whole class.
NASA
Understanding the Effects of Differences in Speed—Problem Set D
Fall back and slow down. The fourth lesson in a six-part series on air traffic control leads the class to find the difference in distance traveled based upon the difference in speed. Pupils work through a problem related to walking...


