Curated OER
Similarity and Dilations - Discover Properties of Similar Figures
Learners investigate properties of similar figures. In this properties of similar figures lesson, pupils construct similar figures using Cabri Jr. They dilate their figure to create a similar one, and discuss the relationships between...
Texas Instruments
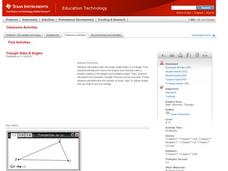
Identifying a Triangle by its Sides and Angles
Identify triangles by their angle measures and side lengths by looking at and measuring angle measures and side lengths. Use Cabri Jr. to construct various triangles, then manipulate the construction to create the 6 types of triangles,...
Texas Instruments
Complex Numbers: Plotting and Polar Form
Explore the concept of, and use the Ti-Nspire to, convert complex numbers into polar form. Then practice graphing complex numbers in the polar coordinate plane.
Curated OER
Proof of Identity
High schoolers explore trigonometric identities. In this Algebra II lesson, students use graphing to verify the reciprocal identities. Using Cabri Jr, high schoolers investigate the Pythagorean trigonometric identities...
Curated OER
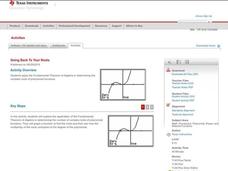
Going Back to Your Roots
Who doesn't need to know the Fundamental Theorem of Algebra? Use the theorem to find the roots of a polynomial on a TI calculator. The class explores polynomials with one solution, no real solutions, and two solutions. This less lesson...
Curated OER
Equivalent or Not Equivalent?
Algebra learners look at equivalent expressions in the context of three different operations: division, squaring, and absolute value. In comparing these values, they will identity when expressions are equivalent.
Curated OER
Nutria And The Disappearing Marsh
Young analysts examine changes in the nutria population, vegetation density, and marsh area over time in the wetlands of Louisiana. They import data and use the TI-73 Explorer to graph and analyze the effects of nutria on marsh loss.
Curated OER
Super Ticket Sales
Use this graphing data using box and whisker plots lesson to have learners make box and whisker plots about ticket sales of popular movies. They find the mean, median, and mode of the data. Pupils compare ticket sales of the opening...
Curated OER
NUMB3RS Activity: Coded Messages
Using matrix multiplication and inverse matrices, students are trying to uncode a coded message. Students encrypt simple messages using 2 x 2 matrices.
Curated OER
Curve Ball
Create a Height-Time plot of a bouncing ball using a graphing calculator. Graph height as a function of time and identify the vertex form of a quadratic equation that is generated to describe the ball's motion. Finally, answer questions...
Curated OER
Quadratic Equations
Using the provided worksheets, students solve equations involving factoring and finding square roots. At the conclusion of the lesson, they discuss the answers and any difficulty experienced in solving the equations.
Curated OER
Rational Functions
Through a mini assessment, students identify and list the vertical and horizontal asymptotes for the given rational functions and determine the type of asymptote of a given rational function. They also decide which form of a function...
Curated OER
Powers and Roots of Complex Numbers
Explore a few powers of complex numbers numerically and decide if there is a pattern and use parametric equations to represent a complex number graphically. Use De Moivre's theorem to represent the roots of the complex number...
Curated OER
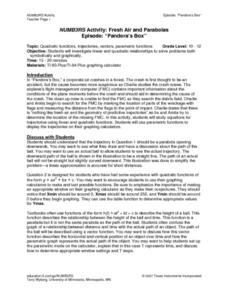
NUMB3RS Activity: Fresh Air and Parabolas
Explore parabolas and investigate linear and quadratic functions to solve problems symbolically and graphically. Also use parametric functions to display trajectories on a graphing calculator.
Curated OER
Zeros of a Cubic
Mathematicians explore cubic functions by learning how to investigate the relationship between the x-coordinates of the three zeros of a cubic function. The lesson also contains an application of differentiation.
Curated OER
Geometry and Measurement
Young geometers explore relationships between units of measure and objects. Three activities provide varied opportunities to practice. Learners calculate the volume of two cylinders made by rolling a piece of paper vertically and...
Texas Instruments
Changing Functions
Your algebra 2 learners show what they can do in this assessment activity on shifting, reflecting, and stretching graphs. Given the graphs of various functions, they write the represented equation.
Texas Instruments
Exploring Basic Equations
Learners explore equations with constants, variables and with exponents. They identify and define variables, constants, exponents, expressions, and equations, as well as give an example of each. Your class will also draw their...
Texas Instruments
Endothermic and Exothermic Processes
Middle schoolers investigate temperature using the TI. In this chemistry lesson, students analyze the change in temperature, as chemicals are dissolved in water. They analyze data collected using the CBL 2.
Visa
Making Spending Decisions
By role playing real-world experiences, such as purchasing snacks and grocery/toy store shopping, your youngsters will begin to develop an understanding of how to make decisions and choose between alternatives. This is the first...
Curated OER
The Pythagorean Theorem and Classifying Triangles
Through the examination of the relationship between the lengths of the sides of a triangles learners will learn the classification of triangles (acute, right, or obtuse).
Curated OER
Algebra 1: Slope as Rate
Students solve problems with slopes. In this algebra lesson, students identify the slope of a line and relate it to the rate of change. They graph their lines on the TI and observe changes in the lines.
Texas Instruments
Function Notation - Texas Instruments
Using a TI-Nspire calculator, learners will work to better understand function notation and input/output functions. They write equations with a function symbols, identify what makes an equation a function, and graph lines in order to...
Curated OER
Influence and Outliers
Using the TI-Nspire calculator, statisicians identify outliers and their effect on the least-squares regression line. In finding the line of best fit, they determine what points will affect the least squares regressions and what points...


