Curated OER
Study Buddies: Classifying Triangles
In this math worksheet, students analyze an informative chart about the measurement and angles of equilateral, isosceles and scalene triangles. Students then answer 5 questions about classifying triangles.
Curated OER
Prisms-Turn Up The Volume
Identify the length, width, and height of prisms. Critical thinkers calculate the volume of prisms given small amounts of information. They derive the formula given the length, width and height.
Curated OER
Frost Depth Study
Students complete activities to study the frost and frost depth. For this frost study lesson, students use frost tubes to study and measure the frost at their school. Students measure the frost in the tube and enter their data online to...
Curated OER
Pacing a Gunther Chain
Students pace a Gunther Chain, a measurement used by foresters to determine distance and area. They discuss that pacing is individualized depending on age, gender, etc. They practice to find an average pace. Teams estimate, pace and...
Curated OER
How Long...?
Students explore measurement. They use appropriate units of measurement for different sized objects. Students collect their data and enter it into an Excel data base. They graph their findings and analyze their outcomes.
Curated OER
Finding Perimeter and Area
Geometers find the perimeter and area of rectangles. They discuss the definitions and characteristics of rectangles and squares. In groups, they use yarn to discover the perimeter of squares and rectangles. They count cubes to explore...
Curated OER
Pythagorean Theorem
In this measurement lesson, learners examine the Pythagorean Theorem, perimeter, and areas of right triangles. They record their measurements and research their findings on a grid.
Curated OER
Discover the Pythagorean Theorem
Students explore the Pythagoras theorem. In this geometry activity, students make right triangles and identify the parts of the triangle. Students complete measurements of the sides of the triangle.
Curated OER
Small Angle Calculations
Students work with circles, angles and estimating angles in the night sky. For this circles and angles lesson, students practice measuring a degree using the circumference of a circle and apply the degree to determine a way to use their...
Curated OER
Collecting Data and Graphing
Young mathematicians collect data and graph it. They work collaboratively to collect data regarding the span of arm length versus height and graph the data they collect.
Curated OER
How Many Units?
Young mathematicians calculate the area of rectangles and squares. For this geometry lesson, learners are grouped in pairs and use geoboards to construct rectangles. They calculate the area of the figure by counting the number of square...
Curated OER
Shapes and Their Insides
Learners follow a series of instructions for drawing and coloring different shapes in order to learn the difference between the perimeter and area of a polygon. Then they are asked to find the perimeter and area of a 3x4 rectangular...
Curated OER
Perimeter All Around
Students explore perimeter and area of regular and irregular polygons. They experiment with color squares and create different arrangements using the same number squares. Then they compare the area and perimeter measurements of each.
Curated OER
Square Roots Using a Carpenter's Square
Students calculate the square root of a given number using carpenter's square measurements. In this math lesson, students relate this method on the Pythagorean theorem. They answer practice problems after the exploration activity,
Curated OER
"Mummies--The Great Cover Up"
Learners wrap their mummy, use canopic-style jars for the preserved chicken organs and design and decorate a sarcophagus. They collect data by weighing, measuring and graphing their "mummy" and its organs.
Curated OER
Graphing Pendulum Results
Sixth graders set up a pendulum experiment deciding which variable to manipulate (length of string or weight on the string). They create a hypothesis, collect necessary equipment, and write out each step of their experiment. They then...
Curated OER
Stick-Slip Movement
Ninth graders operate a model to observe the type of motion that occurs at a fault during an earthquake. They explore the effects of several variables. Students measure movement, calculate averages and plot and graph information.
Curated OER
Toothpick Tops
Pupils assembly tops and name them 1 - 12 so that they can compare their results. They guess which top they think will spin the best and then record data on "Toothpick Top" table. Using a stopwatch or clock to measure and record the spin...
Illustrative Mathematics
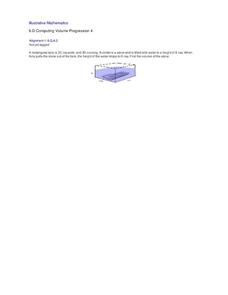
Computing Volume Progression 4
This resource was written for the younger math learner, but finding the volume of an irregular solid is also a problem for algebra and geometry students. Based on Archimedes’ Principle, one can calculate the volume of a stone by...
Curated OER
Stepping Out
Pupils calculate the length of their pace when walking and running and compare them with the other students' paces. Using tape measurers and calculators, they enter their data in a table, calculate the paces, and calculate the pace of a...
Curated OER
Can You Walk a Mile With My Foot?
Young scholars engage in a lesson that is concerned with the measurement of a foot as a customary unit. They take part in a series of activities to help them acquire skills of using a foot to compare other units of measurement. The...
Curated OER
Finding the Shape of a Web
Students examine spider webs they find as they explore outside. They make T-chart of the shapes found in two different webs and draw them on geoboard paper. Next, they measure length and width of a spider's web before checking to see if...
Curated OER
Cuisenaire Fractions
Young scholars study fractions by comparing rations using Cuisenaire rods. They make predictions, measure lengths using Cuisenaire rods and explain their answers. Next, they discuss the relationship of the different rods in terms of...
Curated OER
Sizing Pumpkins
Fifth graders study the sizes of pumpkins. They measure and record the diameters of pumpkins. They create five subtraction problems and solve them. They weigh their pumpkins, record the data and select two pumpkins to make a graph of...

