Curated OER
All in the Family
Students use data to make a tally chart and a line plot. They find the maximum, minimum, range, median, and mode of the data. Following the video portion of the lesson, students will visit a Web site to test their data collection skills...
Curated OER
How Big Is Your Head?
Students explore measurement by measuring classmates' heads. They record their measurements and they put the measurements in order from smallest to largest. Students figure the mean, median, mode, maximum, minimum, and range of their...
Curated OER
Mean, Median, Mode, Minimum, Maximum Posters
Introduce mean, median, and mode and post these bright posters in your classroom. The posters focus on the vocabulary and highlights the answer choice. Each one is colorful, which will engage and attract your learners.
Curated OER
Reaction Time
Students record reaction time data and calculate minimum, maximum, mean, median, and mode. They participate in a class reaction time activity, observe and conduct an online experiment, and discuss and analyze the activity results.
Teach Engineering
Earthquakes Living Lab: Locating Earthquakes
There are patterns in nearly everything — even earthquakes. Pairs research current earthquakes to see if there are any patterns. They determine the mean, median, and mode of the earthquake data, along with the maximum and minimum. Using...
Curated OER
Inquiry Unit: Modeling Maximums and Minimums
Young mathematicians explore the maximun area for patio with the added complexity of finding the mimimum cost for construction. First, they maximize the area of a yard given a limited amount of fence and plot width v. area on a scatter...
CK-12 Foundation
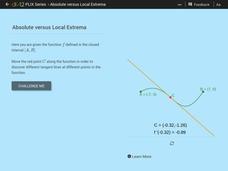
Absolute Versus Local Extrema
Get the class to take an extreme look at functions. The interactive presents a function on a closed interval with a movable tangent line. Using the given function, pupils determine the extrema, critical points, and points of inflection.
Curated OER
Box and Whisker Plots
Seventh graders explore the concept of box and whisker plots. In this box and whisker plots lesson, 7th graders plot data on a box and whisker plot. Students discuss the mean, median, and mode of the data. Students discuss range,...
Curated OER
Statistics
In this statistics worksheet, 7th graders solve and complete 5 different problems related to determining various statistics. First, they find the average of a given set of numbers. Then, students find the median and mode of each set of...
Curated OER
Family Size
In this family size learning exercise, students complete a tally chart to determine data from a family size line plot. They organize the data in the chart to determine the mean, median, mode, and range of the data. There are six...
Curated OER
Cumulative Frequency - Mental Tests
In this measures of central tendency activity, quick-thinking pupils use mental math to find the mean, median, and range of samples. They use mental math to calculate subtraction problems. They complete 20 problems in which the answers...
CK-12 Foundation
Absolute Value Inequalities: The Nuts and Bolts of Allowable Error
Explore the nuts and bolts of absolute value inequalities using nuts and bolts. Pupils use an interactive to see how the minimum and maximum radii of a nut-and-bolt combination change based on the target radius and the allowable error....
CK-12 Foundation
Understand and Create Line Graphs: Line Graphs
Explore line graphs and their characteristics through an interactive lesson. Scholars follow a set of directions to plot data on a line graph. They then answer questions about the type of variables, minimum and maximum values, and...
Curated OER
Math: Reaching New Heights
Students apply math skills to assess the range, mean, mode, and median of data sets. Using a "Reaching New Heights" worksheet, they review and discuss how to calculate the answers. Students write complete explanations of all their...
Willow Tree
Box-and-Whisker Plots
Whiskers are not just for cats! Pupils create box-and-whisker plots from given data sets. They analyze the data using the graphs as their guide.
Curated OER
Measures of Central Tendency
In this measures of central tendency worksheet, students solve and complete 6 different problems. First, they count the number of items in each set of data. Then, students determine the mean, median and mode for each. In addition, they...
CK-12 Foundation
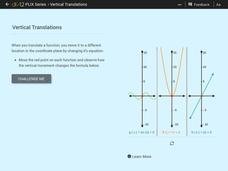
Vertical Translations
Change the y-intercept by adding a constant to the function. Individuals move three functions vertically along the y-axis. As they observe how the equation of the functions change with the vertical movement, learners determine how to...
Curated OER
Creating Bar Graphs
Fifth graders design and label a bar graph using data taken from a class survey. They observe a teacher-led lecture, write and conduct their survey, and create a bar graph that includes identification of the minimum, maximum, mode,...
Curated OER
And Now, the Weather...
Young scholars collect and analyze data. In this middle school mathematics/science lesson, students collect temperature reading over a 24 hour period. Young scholars analyze the data for mean, median, maximum and minimum.
Curated OER
Introduction to Representing and Analyzing Data
Represent data graphically. Allow your class to explore different methods of representing data. They create foldables, sing songs, and play a dice game to reinforce the measures of central tendency.
Curated OER
Eight Integers and Eight Cubes
In this number puzzle worksheet, students are given 8 clues to find 8 integers. Clues refer to measures of central tendencies, abundant numbers, perfect cubes, and palindromes.
Curated OER
How's The Weather?
Students make a box and whiskers plot using the TI-73 graphing calculator. Each student would have their own calculator but they would work in small groups of two or three to help each other enter the data and make the plots.
Curated OER
Math of the Path: Students Calculate Data from the Lewis and Clark Journey
Students use calculations to complete the same journey of Lewis and Clark. They answer questions along their way and share information they gather with the class. They compare their calculations with those made by Lewis and Clark.


