Noyce Foundation
Through the Grapevine
Teach statistics by analyzing raisins. A thorough activity provides lesson resources for five levels to include all grades. Younger pupils work on counting and estimation, mid-level learners build on their understanding of the measures...
Curated OER
Data Analysis
In this data analysis learning exercise, learners solve and complete 6 different problems that include using various types of data analysis. First, they create a stem-and-leaf plot of the ratios shown at the top and determine the mean,...
Inside Mathematics
Suzi's Company
The mean might not always be the best representation of the average. The assessment task has individuals determine the measures of center for the salaries of a company. They determine which of the three would be the best representation...
Curated OER
Lesson #46: Bar Graphs and Line Graphs
In this bar graphs and line graphs worksheet, students interpret bar graphs, line graphs, and box-and-whisker plots. They find the measures of central tendency. This three-page worksheet contains notes, vocabulary, and approximately 10...
Curated OER
Inequalities and Measures of Central Tendency
In this inequality and measures of central tendency learning exercise, students solve and graph linear inequalities. They organize given data to identify the mean, mode and range. Students interpret box-and-whisker plots. This three-page...
Curated OER
Averages
In this averages worksheet, 6th graders solve and complete 3 various types of problems. First, they find the mean, mode, median and range for each set of data shown. Then, students match each team to the picture shown that they think...
Curated OER
Data Analysis
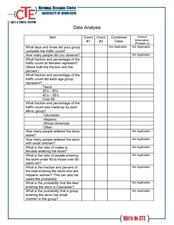
In this data analysis activity, students complete several activities to analyze data. Students calculate the mean, median, mode, and range for the 14 problems.
Curated OER
Stem-and-Leaf Plots
In this stem-and-leaf plots worksheet, 8th graders solve and complete 3 different problems that include creating stem-and-leaf plots to solve problems. First, they determine the median, minimum, range and mode of the given set of numbers...
Curated OER
Beyond Averages: Median, Mode and Range: Post Test
In this data worksheet, students complete a 10 question multiple choice post test about finding the median, mean, mode and range of a set of data.
Curated OER
Measures of Central Tendency
In this measures of central tendency worksheet, students solve and complete 6 different problems. First, they count the number of items in each set of data. Then, students determine the mean, median and mode for each. In addition, they...
Curated OER
Finding Range
For this range worksheet, students enter mean, median and mode for sets of number, then enter the range.
Queensland Government
Means, Modes And Medians
Middle schoolers identify the mean, mode, and median of the heights for males and females who are age 13. They describe the difference between the three words and what each signifies. Finally, pupils fill in a table and calculate the...
Curated OER
Stem and Leaf Plots
In this measures of central tendency worksheet, students study a stem and leaf plot pertaining to weekly low temperatures. Students use the plot to answer 6 questions. There will be a question that requires students to make their own...
Los Angeles County Office of Education
Assessment For The California Mathematics Standards Grade 6
Test your scholars' knowledge of a multitude of concepts with an assessment aligned to the California math standards. Using the exam, class members show what they know about the four operations, positive and negative numbers, statistics...
Curated OER
What Are Your Favorite Apples?
In this tally worksheet, students take a survey to determine the favorite apple. They write tally marks beside the apple chosen. For elementary students, this worksheet may be used for counting purposes and to reinforce what a tally mark...
Curated OER
Box Plots
In this statistics worksheet, students analyze problems by finding the mean, median and mode. They also set data by their median, and quartiles. There are 7 questions dealing with 2 different sections.
Curated OER
Stem-and-Leaf Plots
In this stem-and-leaf plots worksheet, 9th graders solve and complete 9 various types of problems. First, they determine the mean, median, and mode of the stem-and-leaf plot shown. Then, students summarize the similarities and...
Curated OER
Central Tendency
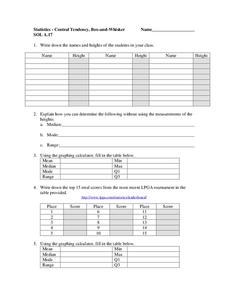
In this central tendency worksheet, students solve and complete 10 different problems that include measures of central tendency. First, they write down the names and heights of students in their class. Then, students explain how they can...
Math Guy
Algebra 1 Practice Final
What makes this resource special? The amazing answer key that comes with worked out solutions and notes for each problem. Practice problems include all topics ranging from linear systems to simplifying exponential expressions. The packet...
Curated OER
Probability and Statistics - Week 10
In this probability and statistics worksheet, students find compound dependent and independent probability of given situations. They identify the mean, mode, range and median of sets. This two-page worksheet contains explanations,...
Curated OER
Live, From New York
In this data analysis worksheet, students study the information on a data table about the hosts of Saturday Night Live. Students answer 8 problem solving questions about the table.
Curated OER
Make and use a Stem-and-Leaf Plot
In this stem-and-leaf plot worksheet, students use a given plot to solve 4 problems, then make a plot for given data and solve related problems. Houghton Mifflin text referenced.
Curated OER
Challenge: Agenian Ages-Statistics
In this statistics/data worksheet, students use given statistics of people from a fictional planet to answer 6 related questions.
Other popular searches
- Range, Mean, Median, Mode
- Range Mean Median Mode
- Mode, Range, Mean, Median
- Range, Median, Mode, Mean


