Statistics Education Web
Sampling in Archaeology
Compare different random sampling types using an archaeological setting. Scholars collect data from an archaeological plot using simple random samples, stratified random samples, systematic random samples, and cluster random samples....
Statistics Education Web
Saga of Survival (Using Data about Donner Party to Illustrate Descriptive Statistics)
What did gender have to do with the survival rates of the Donner Party? Using comparative box plots, classes compare the ages of the survivors and nonsurvivors. Using the same method, individuals make conclusions about the gender and...
College Board
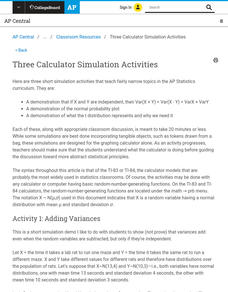
Three Calculator Simulation Activities
Calculators sure come in handy. An AP® Statistics instructional resource provides suggestions for using calculator simulations. It gives activities for adding variances, normal probability plots, and t distributions.
College Board
Is That an Assumption or a Condition?
Don't assume your pupils understand assumptions. A teacher resource provides valuable information on inferences, assumptions, and conditions, and how scholars tend to overlook these aspects. It focuses on regression analysis, statistical...
Georgia Department of Education
The Basketball Star
Have learners use math to prove they are sports stars! Assess a pupil's ability to create and analyze data using a variety of graphs. The class will be motivated by the association of math and basketball data.
Curated OER
Exploring the Normal Curve Family
Young scholars find different characteristics of the bell curve. In this statistics activity, students analyze a family for a specific characteristic. They identify the shape, center, spread and area as they analyze the characteristic of...
Curated OER
Empirical Rule Practice Problems
Using the empirical rule for a normal distribution, young statisticians determine the percent of adult women with given heights and weights. They find the percentile rank of a woman of a stated height and find the area under a curve.
Curated OER
Z-Scores related to Psychology
In this z-score learning exercise, students identify the z-scores and percentiles corresponding to thirteen values. Students are also asked to find two probabilities. Worked solutions are provided after each question.
Curated OER
Measures of Central Tendency
In this Algebra I worksheet, 9th graders determine the measures of central tendency for a given data set. The one page worksheet contains four problems. Answers are provided.
Curated OER
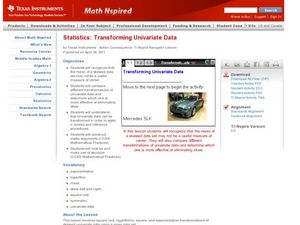
Transforming Univariate Data
Learners analyze plotted data in this statistics instructional activity. They differentiate between skewed and normal data. They also explore and interconnect exponential growth and decay as it relates to the data.
Curated OER
Infusing Equity Gender into the Classroom
Students investigate if gender makes a difference in the classroom. In this statistics lesson plan, students collect data on whether equity by gender in the classroom makes students more successful.
Curated OER
What is a P-value?
Young scholars test the hypotheses using p values. In this statistics lesson, students define and examine conditional probability. They test each statement for a true statement or a false statement, based on the sample size.
Curated OER
Algebra 2/Trigonometry Regents Exam
Students review for the Regents Exam. In this math lesson, students review core concept for the Regents exam by working a variety of problems. A printable worksheet is provided.
Curated OER
Stemmin'-n-Leafin'
Students make stem and leaf charts to determine the measures of central tendency using test score data. They analyze the data to draw inferences which they share with the class. They complete the associated worksheets.
Curated OER
Lyrics Statistics
Students describe, analyze and generalize relationships, patterns, functions using words. symbols, variables, tables and graphs.
Curated OER
Statistical Analysis of Data by Gender
Students examine and identify gender bias, stereotyping, and discrimination in school materials, activities, and classroom instruction. They apply descriptive statistics knowledge to real-world data.
Curated OER
Percentiles
Students analyze the bell curve and make predictions. In this statistics instructional activity, students calculate the percentile to the left of the curve. They then are given the percentile and create the graph from the data.
Curated OER
Central Tendencies and Normal Distribution Curve
Fourth graders are given data (class test scores) to determine central tendencies, and find information needed to construct a normal distribution curve. They become proficient in calculating mode, median and average.
Curated OER
Statistical Analysis For Graphing Calculators
Students analyze date from the Chesapeake Bay. Using a graphing calculator, they enter the data, plot three temperatures, and create a Box and Whisker plot.
Curated OER
Let's Graph It!
Students graph the height of others in centimeters and inches, find the slope of line in order to calculate the conversion factor between centimeters and inches.
Curated OER
Descriptive Statistics
Students demonstrate how to use frequency and scatter diagrams. In this statistics lesson, students are introduced to different techniques of representing data. Students sort and graph data on a worksheet and use a frequency diagram to...


