Hi, what do you want to do?
Curated OER
Mean, Median, and Mode
Students find the mean, median, and mode for a set of data. They define terms and find examples, as well as complete practice exercises. They work cooperatively to analyze real data from a variety of websites provided. To...
Newspaper Association of America
Power Pack: Lessons in Civics, Math, and Fine Arts
Newspaper in Education (NIE) Week honors the contributions of the newspaper and is celebrated in the resource within a civics, mathematics, and fine arts setting. The resource represents every grade from 3rd to 12th with questions...
Curated OER
Energy Audit
Young scholars collect data about energy usage and use mathematical calculations to analyze their data. In this energy conservation and statistics math lesson plan, students survey their homes to complete an energy usage worksheet. Young...
Curated OER
Create a Public Opinion Survey: The Middle East in the News
Though the discrete content here is a pair of New York Times articles about a 1998 military strike on Iraq and the coincident impeachment by the House of Representatives of then-President Clinton, this detailed plan for creating,...
Curated OER
Create Your Own Form
Learners gather and organize data using a mock census form, and determine mean, mode, range, and median for sets of data.
Curated OER
Math: Skyscraper Comparison
Students examine skyscrapers by conducting Internet research and by creating and interpreting graphs. After reading the book, "Skyscraper," they discuss reasons why the structures are built. Once they have researched the tallest...
Curated OER
U.S. Immigrant Statistics
Young scholars compare the populations of ten U.S. states to the number of immigrants who entered those states in a given year and calculate the mean, mode, and median of the grouping. They discuss why some states are more attractive...
Curated OER
Global Statistics
Students select appropriate data to determine the mean, median, mode and range of a set of data. They calculate the statistical data on literacy rates and life expectancy within each geographic region of the world. Students determine...
Curated OER
The Seasonal Round and The Cycle of Life
Fourth graders are introduced to the concept of the seasonal round and how folklife traditions vary from season to season. They begin charting dates of personal interest on seasonal round calendars by starting with birthdays. Students...
Curated OER
Statistics Canada
Students practice using graphing tools to make tables, bar charts, scatter graphs, and histograms, using census data. They apply the concept of measures of central tendency, examine the effects of outliers. They also write inferences and...
Curated OER
What's Your Temperature?
Learners take a look at the local newspaper and focus on the weather section. They get into small groups, and each one looks at the same map, but of a different part of the country. They must prepare a presentation that shows how...
Curated OER
Exquisite Excursions
Learners locate 6 cities, one on each of the 6 major continents. They find distance for each leg of their journey, convert to percents, use a time zone map, and convert to foreign currencies.
Curated OER
How Psychologists Do Research
Students discover how psychologists complete their research on different topics. In groups, they describe the elements of an experiment and the importance of sampling during research. They identify ethical issues in their research and...
Curated OER
Being an Educated Consumer of Statistics
Students examine kinds of data used to report statistics, and create their own statistical report based on any of the four sources of media information (Internet, newspaper, TV, magazine).
Curated OER
A Statistical Study by Adolescent Students on Relevant Issues
Students use statistics to study attributes of a local center for pregnant teenagers. They apply mean, median, mode and a correlation study between two variables.
Curated OER
How Wealthy Are Europeans?
Students investigate measures of central tendency. They examine compiled data and conduct critical analysis. The graph is focusing on the gross domestic product data. The lesson also reviews the concept of putting values in order of...
Curated OER
Historical Temperatures
Students research historical regional temperatures for their current season. In this historical weather lesson, students conduct weather station and Internet research to learn about historical regional temperatures. Students collect and...
Curated OER
Running The Business
In this career worksheet, students are asked to look at the six stages necessary for the success of running a hypothetical new business.
Missouri State University
Missouri State University: Introductory Statistics: Statistics
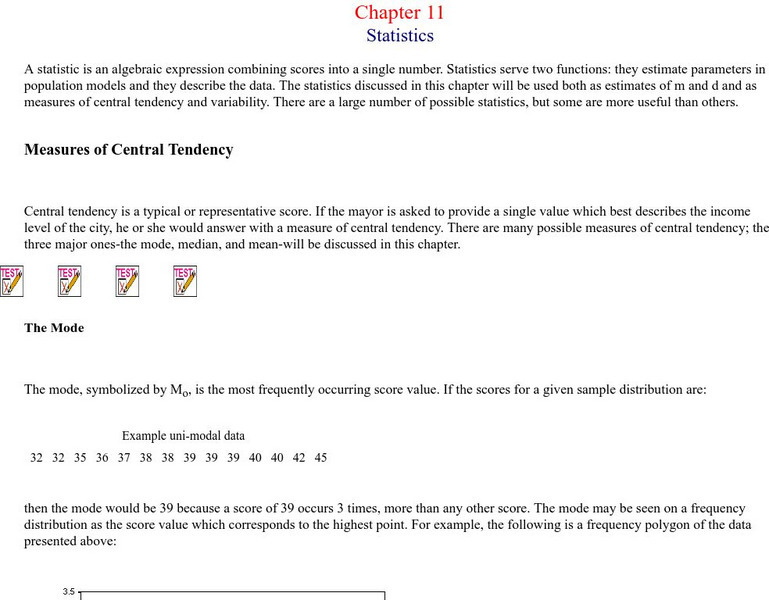
This is an excellent resource on what the science of statistics involves. There are all kinds of definitions, examples, graphs, and charts to learn from. The topics covered include: mode, mean, median, skewed distributions and measures...
Other popular searches
- Mean Median Mode and Range
- Mean, Median, Mode, and Range
- Mean, Mode and Median
- Mean, Median, Mode and Range
- Mean Mode and Median
- Mean and Mode and Median
- Mean, Mode, and Median
- Mode, Mean and Median
- Mean, Median. Mode, and Range


