Hi, what do you want to do?
Curated OER
Descriptive Statistics
Learners demonstrate how to use frequency and scatter diagrams. In this statistics lesson, students are introduced to different techniques of representing data. Learners sort and graph data on a worksheet and use a frequency diagram to...
Curated OER
Drops on a Penny
A helpful worksheet describes an interesting demonstration on the surface tension of water. Learners guess how many drops of water the heads side of a penny will hold. This resource does a great job of describing just how a penny can...
Curated OER
How Many Animals?
Students use their math skills to develop estimates for the population of several animal species native to the Austrailian rainforest. It is a simulation that researchers at the Center for Rainforest Studies in Australia perform to...
Curated OER
FLIGHT FAIR
Learners conduct their personal investigations into paper airplane flight. Cooperative teams are formed, with students choosing the paper airplane design that they are most interested in building.
Curated OER
Infusing Equity Gender into the Classroom
Students investigate if gender makes a difference in the classroom. For this statistics lesson, students collect data on whether equity by gender in the classroom makes students more successful.
Curated OER
How Oceans Affect Climate
Learners draw conclusions about how the ocean affects temperature. In this weather lesson, students use the Internet to gather data to help them come to a conclusion about how the climate in a certain region is directly affected by the...
Curated OER
Chips Ahoy A Thousand Chips In Every Bag
Sixth graders determine whether Nabico's claim to sell 1000 chocolate chips in every 1 pound bag of Chips Ahoy! is true.
Curated OER
Our Class Record Book
Second graders, in groups, prepare a list of proposed record ideas for the class book.
Curated OER
Running The Business
In this career instructional activity, students are asked to look at the six stages necessary for the success of running a hypothetical new business.
TeachEngineering
Teach Engineering: Means, Modes, and Medians
Students experience data collection, analysis and inquiry in this LEGO MINDSTORMS NXT -based activity. They measure the position of an oscillating platform using a ultrasonic sensor and perform statistical analysis to determine the mean,...
Missouri State University
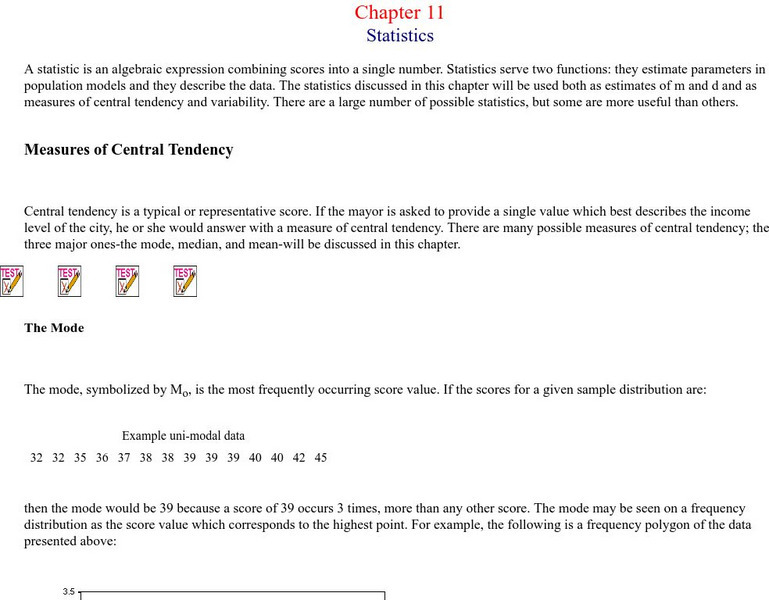
Missouri State U.: Statistics: Measures of Central Tendency and Variability
Provides lengthy explanations of the measures of central tendency - mean, mode, and median - and the measures of variability - range, variance, standard deviation. Graphs of interesting examples are presented as well, skewed...
McGraw Hill
Glencoe: Self Check Quizzes 1 Mean
Use Glencoe's randomly generated self-checking quiz to test your knowledge of finding the mean for a data set. Each question has a "Hint" link to help. Choose the correct answer for each problem. At the bottom of the page click the...
Shodor Education Foundation
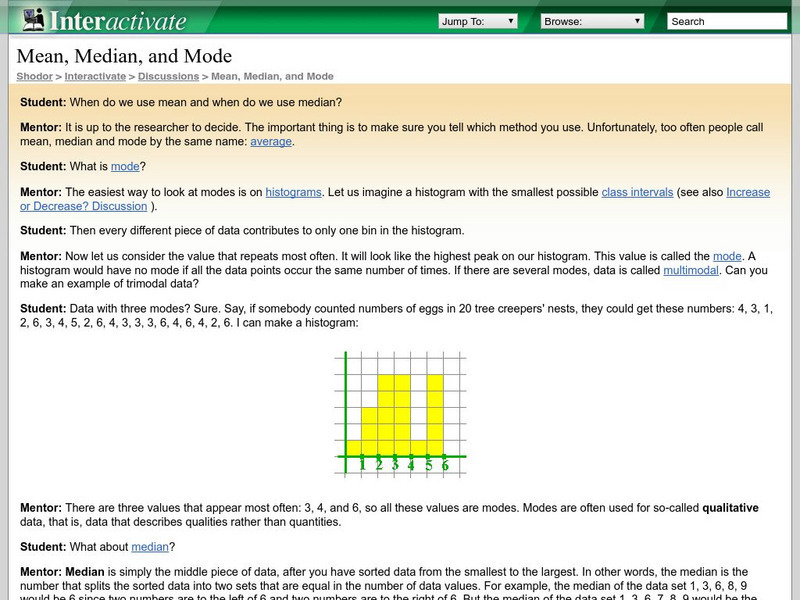
Shodor Interactivate: Mean, Median, and Mode Discussion
This is a virtual discussion between a mentor and student involving mean, median, and mode. Discusses when each is used and how they are found.
McGraw Hill
Glencoe: Self Check Quizzes 2 Mean, Median and Mode
Use Glencoe's Math Course 2 randomly generated self-checking quiz to test your knowledge of finding the mean, median and mode. Each question has a "Hint" link to help. Choose the correct answer for each problem. At the bottom of the page...
Cuemath
Cuemath: Mean, Median and Mode
A comprehensive guide for learning all about mean, median, and mode with definitions, the relation between them, solved examples, and practice questions.
Math Drills
Math Drills: Statistics and Probability Worksheets
Download these free worksheets to sharpen your skills with statistics and probability. Sheets focus on collecting and organizing data, measures of central tendency (mean, median, mode, and range), and probability.
BBC
Bbc Revise Wise Maths: Mode, Median, Mean
This website from the BBC is a great introduction to averages (mean, median, and mode) and will take you through some interactive learning activities. A practice test and worksheet are also provided.
Purple Math
Purplemath: Mean, Median, Mode, and Range
Mean, median, and mode are three kinds of "averages". The "mean" is the "average" you're used to, where you add up all the numbers and then divide by the number of numbers. The "median" is the "middle" value in the list of numbers. To...
Alabama Learning Exchange
Alex: The Mean, Median, and Mode Chain Gang
Cooperative learning groups and chain links are used to find the mean, median, and mode. A Science NetLinks activity is linked for further real-life application in the world of baseball (optional). This lesson plan was created as a...
Texas Instruments
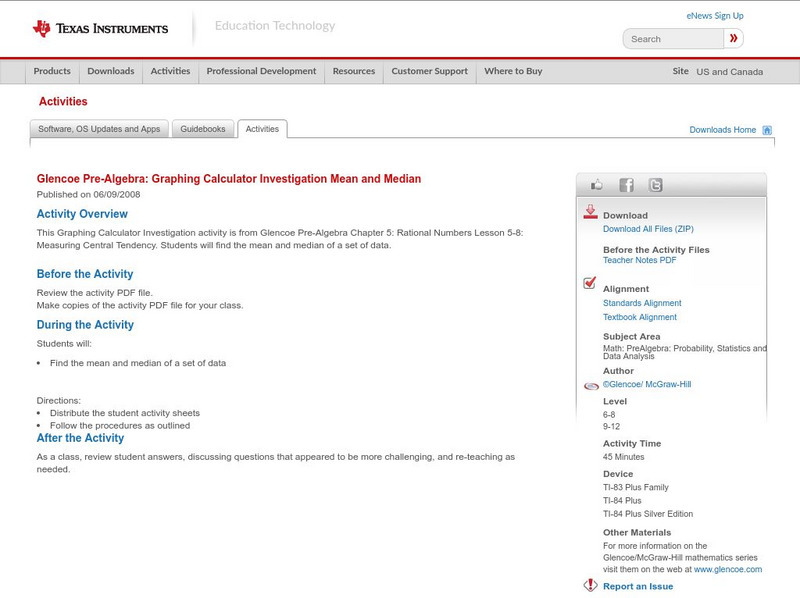
Texas Instruments: Glencoe Pre Algebra: Graphing Calculator: Mean and Median
Students will find the mean and median of a set of data.
Mangahigh
Mangahigh: Data: Use the Range and Mode
This site provides students practice with the concept of range and mode. Students can learn about the topic by completing an interactive tutorial. Students can then take a ten question timed test to practice the skill.
Scholastic
Scholastic: Study Jams! Math: Data Analysis: Mean Average
Students can watch a step by step lesson showing how to determine the mean. Then sing along with a song and test your knowledge of understanding when you have completed the activities.
Other popular searches
- Mean Median and Mode
- Mean, Median and Mode
- Mean Median Mode and Range
- Mean, Median, and Mode
- Mean, Median, Mode, and Range
- Mean, Median, Mode and Range
- Mode, Mean and Median
- Mean, Median. Mode, and Range
- Mean and Median and Mode
- Mean\, Median and Mode


