Curated OER
Mean, Median, Mode, and Range - Homework 14.3
For this data and statistics worksheet, students find the mean, median, mode, and range of 4 different sets of data. Next, students solve 1 word problem where they find the mean.
Curated OER
Confidence Intervals: Population Mean; Population standard Deviation Known
In this confidence interval worksheet, students examine a given confidence level and sample data to determine the margin of error, identify a confidence interval, list the mean and give the standard deviation. Students complete seven...
Curated OER
What Does Success Mean to Me?
One can't set goals until he knows what he needs to feel successful. Learners discuss what they believe it means to be successful. They then fill out a graphic organizer showing four different paths to a successful adult life.
Curated OER
Signed Number Operations and Absolute Value
Students examine methods for adding, subtracting, multiplying and dividing signed numbers. The observe animated illustrations of each operation. students discover the basic meaning of absolute value. They compute problems after instruction.
Curated OER
Mean, Median and Mode
Young statisians work with sets of data. They find mean, median and mode, and discuss the effects of outliers on the data set.
Curated OER
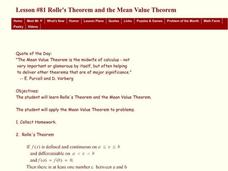
Rolle's Theorem and the Mean Value Theorem
Twelfth graders investigate the applications of the mean value theorem. In this calculus instructional activity, 12th graders apply the concepts of the mean value theorem to real life scenarios problems and relate it to Rolle's theorem....
Curated OER
Colored Pencil Value Practice
Budding artists discover what color value means with regard to art. They read the definition of color value at the top of the page, choose three different colored pencils, then use the provided spaces to create color values with each. By...
Curated OER
What Does It All Mean?
Students investigate the symbolism and meaning of samplers in American history. In this American history and sampler lesson, students examine pictures of original samplers and look at lists of the symbolism included in them. They connect...
Flipped Math
Calculus AB/BC Mid-Unit 5 Review: Analytical Applications of Differentiation
It's time to put analytical applications to work. Learners use the eight questions of the mid-Unit 5 review to refresh their memories of the key points. Pupils apply what they have learned to use the Mean Value Theorem, find extrema...
Willow Tree
Mean, Median, and Mode
Statistics are more than just numbers—they can give you important information about a set of data. Pupils learn how to find the mean, median, and mode of a data set. They also find the next score to reach a desired mean.
EngageNY
Estimating Centers and Interpreting the Mean as a Balance Point
How do you balance a set of data? Using a ruler and some coins, learners determine whether the balance point is always in the middle. Through class and small group discussions, they find that the mean is the the best estimate of the...
Scholastic
Lesson 2: Values and Barriers
Scholars investigate and discuss the importance of values and how they can be used to break barriers. Small groups work collaboratively to examine the text and draw inferences to answer questions. A writing assignment challenges pupils...
EngageNY
Expected Value of a Discrete Random Variable
Discover how to calculate the expected value of a random variable. In the seventh installment of a 21-part module, young mathematicians develop the formula for expected value. They connect this concept the dot product of vectors.
Curated OER
The Statue of Liberty: The Meaning and Use of a National Symbol
Engage your class in a series of activities, each related to the use or analysis of symbols used to convey patriotic or national concepts. They identify different national symbols and explain their meanings, discussing the importance of...
Curated OER
Word Problems That Involve the Mean (II)
In this word problem instructional activity, learners examine real world problems. They compute the mean, median, and mode of given problems. This one-page instructional activity contains 5 multi-step problems. Answers are provided.
Franklin D. Roosevelt Presidential Library & Museum
What Does It Mean to Be an American?
A series of four activities focuses young scholars' attention on what it means to be an American. They identify key qualities, values, and virtues they consider shared by Americans. Participants then pretend they have been selected to...
Noyce Foundation
Baseball Players
Baseball is all about statistics. Pupils solve problems related to mean, median, and range. They calculate the total weight of players given the mean weight, calculate the mean weight of reserve players given the mean weight of the...
EngageNY
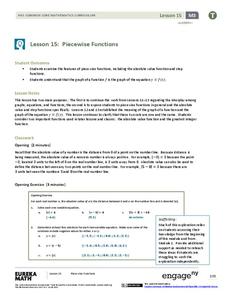
Piecewise Functions
Show your class members that if they can graph a linear function, they can graph an absolute value function. Groups create an absolute value graph using a table, then entertain the idea of an absolute value function defined as two pieces...
Noyce Foundation
Ducklings
The class gets their mean and median all in a row with an assessment task that uses a population of ducklings to work with data displays and measures of central tendency. Pupils create a frequency chart and calculate the mean and median....
Curated OER
Measures of Central Tendency- Mean, Median, and Mode
In this measures of central tendency learning exercise, students read explanations of mean, median, and mode. They complete 6 multiple step questions that require them to find the measures of central tendency for different data sets....
Curated OER
Mean, Median, Mode, and Range
In this mean, median, mode, and range worksheet, students define and solve 5 detailed questions that include finding the mean, median, mode, and range of numbers. First, they calculate the mean, median, mode, and range for each set of...
Curated OER
Find the possible values for the Median
In this online math learning exercise, students find values for the median given a variety of sets of data. This excellent resource allows the students to check their answers, and to get "hints" should they run into difficulties. A...
Curated OER
Place Value Charts to the Millions Place
In this math worksheet, students learn to read, write, order and compare numbers and place them on a place value chart. Students begin the 4 pages of exercises by studying a sample place value chart. Students then fill out 3 other charts...
Alabama Learning Exchange
The Mean, Median, and Mode Chain Gang
Students analyze a set of data. They work in cooperative groups and use chain links to identify the mean, median, and mode of the chain.


