Curated OER
Too Heavy For Me
Students explore the different arrangement of air molecules in high and low air pressure masses. They compare the temperature of high and low pressure masses and discover how a barometer works.
Curated OER
Outlining Area
Explore measuring various objects using square centimeters. Learners create various shapes using five centimeter cubes, calculate the area in square centimeters of different classroom objects, and discover who has the largest mouth,...
Curated OER
Spoonfuls, Cupfuls and Handfuls
Explore the use of non-standard units for measuring volume with elementary learners. They fill a container and count the number used using cups, spoons, and bottles, build with blocks and count the number of blocks used, and compare and...
EngageNY
Newton’s Law of Cooling
As part of an investigation of transformations of exponential functions, class members use Newton's Law of Cooling as an exponential model to determine temperature based on varying aspects. The resource makes comparisons between...
Kenan Fellows
Climate Change Impacts
Turn up the heat! Young mathematicians develop models to represent different climates and collect temperature data. They analyze the data with regression and residual applications. Using that information, they make conclusions about...
Illustrative Mathematics
Telling a Story With Graphs
Turn your algebra learners into meteorologists. Learners are given three graphs that contain information about the weather in Santa Rosa, California during the month of February, 2012. Graph one shows temperatures, graph two displays the...
Kenan Fellows
Designing and Analyzing Data Collected from Wearable Devices to Solve Problems in Health Care
Wearable devices have become more the norm than the exception. Learners analyze data from a sample device with a regression analysis in a helpful hands-on lesson. Their focus is to determine if there is a connection between temperature...
Chymist
Energy of a Peanut
Are you nuts? An engaging experiment burns nuts to find their kilocalories. Young chemists analyze at least two different types of nuts with their experimental results versus what is on the package. The resource offers a great lab...
Curated OER
How Long Does It Take?
Students investigate the lengths of time various activities take and calculate how long is spent on these activities in a week. They complete a worksheet for each activity that is timed, and calculate lengths of time for simulated...
Curated OER
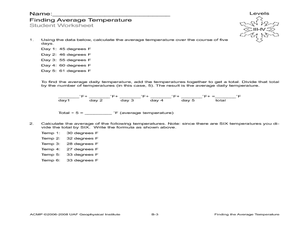
Finding the Average Temperature
Students calculate averages. In this average temperature lesson, students collect data and use their problem solving skills to calculate average temperatures.
Curated OER
Math: Customary or Standard Measurement
Students examine resource links to examine types of measurement. They play interactive games to practice conversion. They inspect digital and analog clocks as well as the three temperature scales,
Curated OER
Measuring Ourselves
Fifth graders conduct various measurement activities on themselves and a partner. They measure their height, weight, thumb-to-pinky span, and body temperature, recording the information in the form of an Excel spreadsheet.
Curated OER
Trends of Snow Cover and Temperature in Alaska
Students compare NASA satellite data observations with student surface measurements of snow cover and temperature. They practice data collection, data correlations, and making scientific predictions.
Curated OER
Math Investigations Facilitation Plan
In this math lesson plan, students choose a topic involving math that interests them to investigate or research. Students make a plan detailing how they will investigate their topic; such as, keeping track of plant heights over time,...
Curated OER
Temperature Bar Graph
Students explore mean, median and mode. In this math lesson, students analyze temperature data and figure the mean, median, and mode of the data. Students graph the data in a bar graph.
Curated OER
Math Review for Grade 3 (3.2)
In this math review for grade 3 (3.2) worksheet, 3rd graders answer 25 multiple choice questions in standardized test format.
Curated OER
Measure Me!
Third graders use nonstandard concrete methods to estimate and record measurements of their body.
Curated OER
Celsius Tells Temperature, Too
Second graders become aware that thermometer liquids expand or contract as temperature affects them.
Curated OER
Temperature and Pressure on Airplane Surfaces
Students use the Internet to delve into the relationship between fores and motion on a sizable object. They predict where they think the temperature and pressure be the greatest, and where the pressure be the lowest.
Curated OER
Measurement Via Triangulation
Young scholars investigate various common terms of measurement, sort them into categories, select the uncommon terms, and construct conversion tables for both the common and the uncommon terms of measurement.
Curated OER
Party Volumes: Measurement
Second graders explore liters and milliliters. They estimate volume and accurately measure the volume. Students plan a party and measure volume using liters and milliliters as part of the planning process.
Curated OER
Hot n' Cold
Students keep a weather log. For this weather and temperature lesson, students discuss the information that can be obtained from a map and lead into a discussion about temperature. Students watch a video about temperature and...
Curated OER
A Plop and Fizz
Seventh graders perform an experiment to determine the effect of temperature on reaction rates. In this chemistry lesson, 7th graders take measurements and record data. They create a graph and analyze results.
Curated OER
High Mountain Retreat
Students explore and analyze atmospheric conditions for a high mountain retreat. They examine the relationship between altitude, atmospheric pressure, temperature and humidity at a particular location. In addition, they write reports...

