Curated OER
Hot n' Cold
Students keep a weather log. For this weather and temperature lesson, students discuss the information that can be obtained from a map and lead into a discussion about temperature. Students watch a video about temperature and...
Curated OER
Keeping Warm When it is Cold: How does a polar bear keep warm?
Students make a model of a polar bear and discuss why fur/skin color is important. They also perform a simple experiment using black and white socks to determine how color affects temperature.
Curated OER
How Can You Measure This?
Third graders work in small groups to complete a number of investigations in which they have to use measurement. They determine the fractional part of the newspaper that is used for news, sports, etc. They compare their height to their...
Curated OER
Measuring Ourselves
Fifth graders conduct various measurement activities on themselves and a partner. They measure their height, weight, thumb-to-pinky span, and body temperature, recording the information in the form of an Excel spreadsheet.
Curated OER
Does salt have an effect on the temperature of ice?
Students explore the effect that salt has on the temperature of ice. In this scientific inquiry lesson, students observe an experiment to see how cold ice can get when salt is added. Students then explore how the ice compares to...
Wild BC
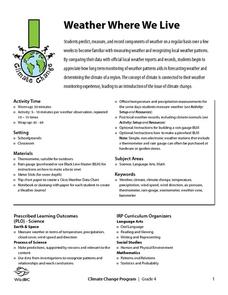
Weather Where We Live
Over a span of two weeks or more, mini meteorologists record weather-related measurements. What makes this particular resource different from others covering similar activities are the thorough details for the teacher and printables for...
Curated OER
Cold, Clouds, and Snowflakes
Students explore satellite data and graphing. In this weather data analysis math and science lesson, students analyze NASA satellite data to draw conclusions about geographical areas where precipitation might have happened. Students...
Curated OER
Spoonfuls, Cupfuls and Handfuls
Explore the use of non-standard units for measuring volume with elementary learners. They fill a container and count the number used using cups, spoons, and bottles, build with blocks and count the number of blocks used, and compare and...
Curated OER
Hot and Cold Colors
Students experiment with the color and solar energy absorption. In this color and solar energy absorption lesson, students spend two days discussing and experimenting with the concept of energy absorption. They paint cans with different...
Curated OER
Stream Consciousness
Actual stream water is analyzed in this environmental science activity. Participants measure water temperature and pH, and then survey the macroinvertebrates living in their samples. The data worksheet, troubleshooting tips, and...
Beyond Benign
Exothermic and Endothermic Reactions
How can you tell the difference between endothermic and exothermic reactions? Chemistry scholars perform and observe two chemical reactions, measure the temperature throughout, then draw conclusions about changes in energy from their...
Curated OER
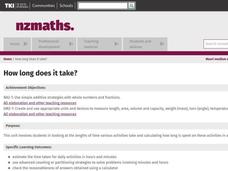
How Long Does It Take?
Students investigate the lengths of time various activities take and calculate how long is spent on these activities in a week. They complete a worksheet for each activity that is timed, and calculate lengths of time for simulated...
National Wildlife Federation
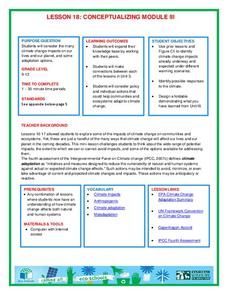
Conceptualizing Module III
Many researchers focus on one impact of climate change in isolation, but researchers gain a global perspective when they come together. A timely lesson teaches scholars about the projected impacts of global temperature increases. Then...
Curated OER
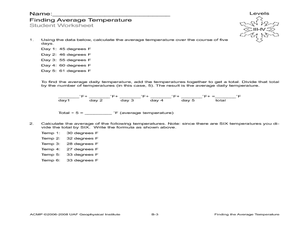
Finding the Average Temperature
Students calculate averages. In this average temperature lesson, students collect data and use their problem solving skills to calculate average temperatures.
Curated OER
Measure Me!
Third graders use nonstandard concrete methods to estimate and record measurements of their body.
Curated OER
A Heated Discussion
Students compare the colloquial definition of temperature with the scientific definition. They, in groups, then explore the changes of water under different temperatures and calculate and compare their findings on three different...
Curated OER
A Plop and Fizz
Seventh graders perform an experiment to determine the effect of temperature on reaction rates. In this chemistry lesson, 7th graders take measurements and record data. They create a graph and analyze results.
Curated OER
Heating and Cooling a Really Large Lizard
Students investigate the effect of temperature on cold-blooded animals, using a 5 x 8 inch index card to represent a dinosaur as their model organism. Students measure temperature changes that occurs at different angles to a light...
Curated OER
Feeling the Heat
Students investigate the urban heat island effect. For this urban heat island effect lesson, students learn how trees, grass, asphalt, and other things on the school grounds effect temperature. They use the information to generalize it...
Curated OER
Modeling Hot and Cold Planets
Young scholars, in teams, design and construct models of two planets, one hot and the other cold, using a variety of materials. They attempt to create the models out of substances that will actually show the greatest temperature...
Curated OER
Classroom Meteorologists: An Experiential Approach to Learning about Seasons and Weather
Students examine several concepts about weather in the seven lessons of this unit. This year long activity helps students to gather data seasonally about wind, clouds, precipitation, and temperature. Earth's three climate zones are...
Curated OER
Graphing Toad/ Frog Respiration
Learners measure respiratory rates on live toads, and the effect water temperature has on their findings. In this scientific method lesson plan, students record their findings and present them in a graph, comparing the results.
Curated OER
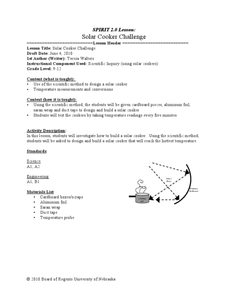
Solar Cooker Challenge
Young scholars use the scientific method to design a slow cooker. In this experimental method lesson plan students measure temperatures and conversions of the solar cooker that they create.
Curated OER
Glacier Dynamics
Students create flubber glaciers. In this glacier dynamics lesson plan, students experiment factors that may affect glacier speed. Factors include slope, ice temperature, and basal conditions. Students develop hypothesis, conduct...
Other popular searches
- Measuring Temperature Math
- Measuring Temperature Lab
- Measuring Temperature Change
- About Measuring Temperature
- Winter Measuring Temperature


