Curated OER
Metric Magic
Sixth and seventh graders construct a "metric machine" as a kinesthetic aide in converting from one unit to another in grams, liters, or meters. They complete a metric activity on the Internet and view about five minutes of a video on...
Pennsylvania Department of Education
Build What I've Created
n this geometric instructional activity, young scholars define and identify two dimensional shapes based on their attributes. They complete worksheets based on the geometric concepts.
Curated OER
Discovering Density
Students explore the physical properties of density. In this hands-on lesson, students calculate density and distinguish between intensive and extensive properties.
Curated OER
Figuring Elapsed Time
Students discover the concept of elapsed time. In this calculating time lesson, students utilize the Internet to complete record sheets based on the concept of elapsed time. Finally, the students answer questions on their own.
Curated OER
Our Favorites
Students participate in and conduct a survey to determine various class favorites. They collect, organize and display their data, interpret the results, and complete a packet of worksheets to display the information.
Curated OER
Lesson Exchange: Polygons (Middle, Mathematics)
Students discover the relationship between the sides of a polygon and the number of diagonals that can be drawn from one vertex, the number of triangles that those diagonals form, and the sum of the interior angles of that polygon.
Curated OER
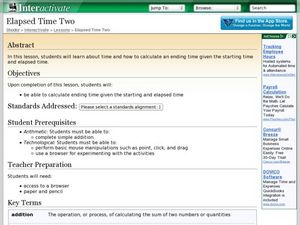
Elapsed Time Two
Students study how to calculate elapsed time. In this elapsed time lesson, they determine how to calculate the ending time of an event when they are given the starting time and the elapsed time. They participate in direct instruction,...
Curated OER
Maps and Modes, Finding a Mean Home on the Range
Fifth graders investigate data from maps to solve problems. In this data lesson, 5th graders study maps and collect data from each map. Students present their data in a variety of ways and calculate the mode, mean, median, and range.
Curated OER
Tick Around the Clock
Students examine and discuss the differences between clocks they are shown. Using the internet, they research how people used to tell time before clocks. They review what the long and short hand on the clock represent and practice...
Curated OER
Density of a Paper Clip Lab Review
Even though this assignment is brought to you by Physics Lab Online, it is best used as a math practice. Middle schoolers calculate the range, mean, mode, and median for a list of eight different paper clip densities. They analyze...
Curated OER
Connecting Formulas Related to Geometric Figures
Students identify diagrams of quadrilaterals and circles by different names and classify the figures. They name the areas for each diagram and practice solving the formulas for each.
Curated OER
Box and Whiskers
Middle schoolers discover how to relate collected data with a box and whiskers graph in a number of formats. They collect, organize, create, and interpret a box and whiskers graph. Pupils interpret the difference between sets of data,...
Pennsylvania Department of Education
Length and Perimeter
Third graders explore tessellations and the spatial concepts used in creating them. In this tessellations lesson plan, 3rd graders rotate, reflect and transform shapes to create tessellations. Students become familiar with the...
Curated OER
Exploring Area and Perimeter
Two students are blindfolded and each receives a cardboard square, one with pompoms glued around the edge and one with pompoms glued all over the surface. They identify what they feel. The class discusses perimeter and area of polygons....
Curated OER
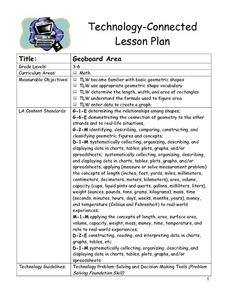
Geoboard Area
Students explore the basic geometric shapes and geometric shape vocabulary through the use of geoboards and virtual geoboards. They create a variety of shapes with a partner, build ten different rectangles on their geoboards, and...
Curated OER
Beads, Balls, and Beakers
Learners analyze the amount of space required to pack round objects. In this geometry instructional activity, students practice using space economically by practicing packing spheres into beakers. They then translate this concept to...
Curated OER
Modeling the Keeling Curve with Excel
In this modeling the Keeling Curve worksheet, students use given data beginning in 1960 to create a mathematical model for the changes in atmospheric carbon dioxide over time. Students manipulate the equation to predict the carbon...
Curated OER
Making Benchmards--Length
Learners explore the idea of having Benchmarks to estimate the length of given objects. Students demonstrate acquired knowledge of the basic units of length by making reasonable estimates. Learners create a personal benchmark.
Curated OER
Scaling Our School
Fourth graders practice estimating the length and height of buildings at their school. They then compare their estimations with the actual heights or lengths. Each student then builds a scale model using ratio to translate the "real"...
Curated OER
How Fast Is Fast?
Students make sensible estimates and check the reasonableness of the answers. Students write and solve problems involving decimal multiplication and division. Students perform calculations with time.
Curated OER
How Hot Is It?
Fourth graders practice estimating temperatures. They practice in Celsius and Fahrenheit.
Curated OER
A Real Difference
Fifth graders use the Celsius and Fahrenheit thermometers to compare temperature readings. They use the Internet to find the temperatures of selected cities. After data is collected for five days, 5th graders graph the temperatures.
Curated OER
Time: Attribute
Students participate in five teacher-led, whole class activities that explore sequences of time and the concept of faster and slower. They sequence school day events, create a book of their daily schedule, put the days of the week in...
Curated OER
Biospheres in Your Backyard
Students collect data from a local river biome. They use the information for metric conversion and graphing equations. They study the components of what makes up a biosphere and how math is used to analyze one.


