PBS
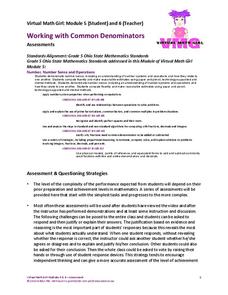
Working with Common Denominators: Assessments
Now that the practice is over, see if young mathematicians can utilize their new skills on finding common denominators and adding fractions. The assessment contains one map challenge and follows with skills practice.
Yummy Math
Parametric Equations and a Heart
Trigonometry, art, and Valentine's Day come together in a creative activity about parametric equations. Learners calculate several equations before graphing them either by hand, on a graphic calculator, or Excel spreadsheet to curve...
Curated OER
How to Do Long Division
Here is a calculating the quotients worksheet in which learners read the steps to solve and observe the example of a division problem before solving the long division problems with remainders. They solve 12 problems.
Curated OER
Probability of Numbers
In this applying the probability of numbers from one to fifty learning exercise, students find divisors, prime numbers, composite numbers, and designated place value numbers. Students solve five problems.
Curated OER
Relationship of Angles
A direct, graphically clean practice sheet for identifying complementary, supplementary, and vertical angles. Given a diagram, learners simply write the correct designation on the line. Six problems are presented.
Curated OER
Prime Factorization: Finding Factors in the Fifth Grade
The lesson starts out with a brain drain, which is a great way to get students to activate prior knowledge and build lasting connections. They tell everything they know about prime factorization, use their knowledge to...
Statistics Education Web
First Day Statistics Activity—Grouping Qualitative Data
Making groups of groups can help to organize data. Classes use statistics to group themselves using descriptive adjectives. The objective is for learners to understand that grouping qualitative data is useful when the original groups are...
National Council of Teachers of Mathematics
National Debt and Wars
Take a functional approach to the national debt. Learners collect information about the national debt by decade and plot the data. They determine whether an exponential curve is a good fit for the data by comparing the percent changes...
Curated OER
Poly-Mania
This hands-on lesson takes young geometers on a tour of 2D polygons and 3D polyhedrons. After exploring different web resources and discussing geometric shapes, small groups construct models of polyhedrons using bendable straws. Note:...
Ohio Department of Education
Describing and Creating Plane Figures - Grade One
Young mathematicians draw, create, and describe different shapes using triangles. They discuss attributes of the original and created shapes. Pupils classify the created shapes and draw and write in mathematics journals to communicate...
Curated OER
How Long Can You Go?
Eighth graders examine the usefulness of a line of best fit by collecting and graphing data, using a graphing calculator to determine the line of best fit, and making a variety of predictions. They watch a video, then design a...
Curated OER
Speed
Fifth and sixth graders practice working in pairs to determine whether they can walk with constant speed. They test themselves, collect their data, draw graphs with their data collected, manipulate the data, and then draw conclusions...
Curated OER
Division by Fractions (Part One)
Learners demonstrate array models to illustrate division as sharing and grouping. They demonstrate the array models to compare division as sharing with division as grouping. Pupils explore division problems are typically seen as either...
Curated OER
Division by Fractions (Part Two)
Investigate division through the use of array models. The lesson plan focuses on using area models to compare division as sharing with division as grouping. Students evaluate the usefulness and limitations of the two array models.
Curated OER
How Many Raisins?
Students study the concept of addition. They create verbal number stories with numbers from one to five. They draw a slice of bread with a line down the middle and cut the bread shapes out of a "slice of bread" and a handful of raisins,...
Curated OER
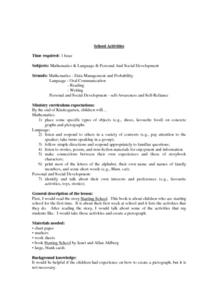
School Activities
First graders place some specific types of objects (e.g., shoes, favorite food) on concrete graphs and pictographs. They listen and respond to others in a variety of contexts (e.g., pay attention to the speaker; take turns speaking in a...
Curated OER
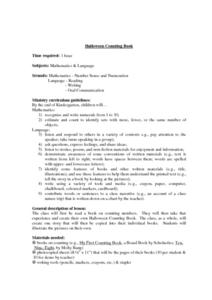
Halloween Counting Book
First graders recognize and write numerals from 1 to 10. They estimate and count to identify sets with more, fewer, or the same number of objects, listen and respond to others in a variety of contexts, and take turns speaking in a...
Curated OER
Chopping Cubes
Middle schoolers work in small groups to make various geometric solids with Play-Doh. They use fishing line to make cuts and observe the shapes of the cross-sections. Pupils complete an assessment in which they answer questions such as:...
Curated OER
Around the Clock
Students discover the relationship between the circumference of a circle and its diameter. They find the length of an arc of a circle.Students use estimation strategies in real-world applications to predict results (i.e., interpolation...
Curated OER
Human Population- Changes in Survival Rates Data Interpretation
In this human population changes in survival worksheet, students interpret and plot data to understand the differences in human mortality and survivorship between historic and modern times. They investigate how these changes influence...
Curated OER
Which Holiday Parades Have You Seen?: Graph
First graders ask their classmates which holiday parades they have seen and record the responses to complete the graph. A basic lesson, but great for teaching or strengthening graphic skills.
Curated OER
Word Problem Solving Strategies Cookies 2
This is a fantastic template to guide scholars in solving math word problems! Learners read a word problem dealing with sales and profits, and fill in a graphic organizer to guide the process. They consider important information, the...
Curated OER
Reading and Interpreting Graphs
In this reading and interpreting graphs worksheet, students answer 8 word problems that involve reading information from a graph about pizzas. Students then review a second graph centered on music and answer 12 questions.
Curated OER
Evaluating Expressions
In this evaluating expressions worksheet, students solve and complete 50 various types of review problems. First, they complete each sentence and define the listed terms. Then, students evaluate each expression for the given values. They...


