Curated OER
Froot Loops to the Max - Nutrition Worksheet
In this nutrition worksheet, pupils solve 10 various problems related to reading the nutritional panel on the side of a box of Froot Loops. They determine how many cups are needed to achieve a certain amount of calories. Then, students...
Curated OER
Froot Loop to the Max - Ordered pairs
In this Froot Loop to the Max worksheet, students complete 21 different sets of ordered pairs. They plot each of the ordered pairs listed on the sheet, connecting them in order from #1 through #21. Then, students determine whether it is...
Curated OER
Find Minimum and Maximum
In this math activity, students analyze 24 groups of 6 numbers each. Students write the minimum number and the maximum number in each set. There are no examples; it appears that students are to write the biggest and smallest numbers in...
Curated OER
Representing Data 2: Using Box Plots
What information can be gleaned from a box and whiskers plot? Discuss the five summary values - minimum, maximum, upper and lower quartiles, and median - and what conclusions can be made from these values? Included here is a matching...
Illustrative Mathematics
The Florist Shop
A real-world approach to common multiples asks learners to find different groups of flowers based on their multiples. Useable as a class activity or independent exercise, they will have to organize their thoughts to explain the totals of...
Willow Tree
Line Plots
You can't see patterns in a jumble of numbers ... so organize them! Learners take a set of data and use a line plot to organize the numbers. From the line plot, they find minimum, maximum, mean, and make other conclusions about the data.
Balanced Assessment
Triangle in Circle
Even kindergartners can draw triangles in circles, but the assessment task requires a bit more geometric knowledge. Scholars investigate triangles that have a diameter of a circle as one of its sides. They must consider triangles that...
Illustrative Mathematics
Hours of Daylight 1
The midline of the mathematical model of the number of hours of sunlight is not 12 hours. Pupils use the modeling cycle to determine a function that will model the number of hours of sunlight at a location of their choosing. Using...
CK-12 Foundation
Combination Problems: Friends at a Party
Friend or stranger? Can there be less than three in a group? The interactive asks learners to prove that for seven people at a party, at least three of them are either mutual friends or mutual strangers. Pupils determine the number of...
CK-12 Foundation
Absolute Value Inequalities: The Nuts and Bolts of Allowable Error
Explore the nuts and bolts of absolute value inequalities using nuts and bolts. Pupils use an interactive to see how the minimum and maximum radii of a nut-and-bolt combination change based on the target radius and the allowable error....
CK-12 Foundation
Understand and Create Line Graphs: Line Graphs
Explore line graphs and their characteristics through an interactive lesson. Scholars follow a set of directions to plot data on a line graph. They then answer questions about the type of variables, minimum and maximum values, and...
Curated OER
Three Methods for Using Quadratic Functions to Model Data
In this modeling data worksheet, students use quadratic functions to model data using three different methods. This worksheet provides explanations and an example. Additionally, students are given the steps to find the maximum or...
Curated OER
All in the Family
Students use data to make a tally chart and a line plot. They find the maximum, minimum, range, median, and mode of the data. Following the video portion of the lesson, students will visit a Web site to test their data collection skills...
Curated OER
Worksheet #7
In this maximum and minimum of values worksheet, students solve 4 problems, two of which are word problems, related to determining values of a given variable. First, they find the maximum value of P subject to its constraints. Then,...
Curated OER
Solving Quadratic Equations by Graphing
For this quadratic equation worksheet, students solve quadratic equations by graphing on a coordinate plane. Given the roots and maximum or minimum points, students graph a quadratic equation. This one-page worksheet contains five problems.
Illustrative Mathematics
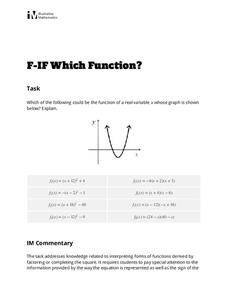
Which Function?
Learners are given a graph of a parabola on a coordinate system, but intercepts and vertex are not labeled. The task is to analyze eight given quadratic functions and determine which ones might possibly be represented by the graph. The...
Curated OER
Credit - Good? Bad?
Students examine credit cards. They explore the detrimental effects that result from debt and poor credit. Students analyze interest rates, minimum balances, and consumer debt. Students survey the benefits of credit cards.
Curated OER
How Big Is Your Head?
Students explore measurement by measuring classmates' heads. They record their measurements and they put the measurements in order from smallest to largest. Students figure the mean, median, mode, maximum, minimum, and range of their...
Curated OER
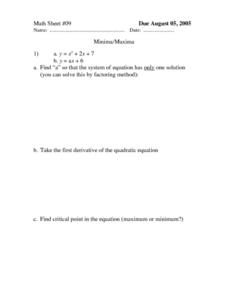
Minima/Maxima
In this minima/maxima worksheet, students solve systems of equations, identify the first derivative of a quadratic equation, and find the critical point in an equation. Using Excel worksheets, students graph four equations. There are...
Curated OER
Absolute Value Equations
In this absolute value equations worksheet, students solve 10 different problems that include various absolute value equations. First, they split the equations into its two possible cases, one case for each sign, and remove the bars....
Curated OER
Find Minimum and Maximum
Learners engage in a lesson about finding the values of different graphs written in the vertex form. They rewrite each quadratic equation in vertex form while graphing the equation with the visual display of a parabola that matches the...
Curated OER
Finding Roots and Newton's Method
In this roots instructional activity, students identify the local maxima and minima for a function. Students find the roots of the function using roots and Newton's Method of approximation. This three-page instructional activity...
Curated OER
Wages, Salaries, and Such
Learners investigate the economics of a job by computing wages based on days, weeks and years. For this vocational lesson, students complete hourly wage worksheets based on employment information. Learners utilize average income data...
Flipped Math
Unit 10 Review: Quadratics
Everything one wanted to know about parabolas in one place. Pupils work 27 problems as a review of the unit on quadratics. Problems range from determining key features of the function and using that information to graph the parabola, to...
Other popular searches
- Maximum Minimum
- Minimum Wage
- Maximum Minimum Parabolas
- Maximum Minimum Mode
- Maximum Minimum Extrema
- Minimum Wage Game
- Global Maximum or Minimum
- Minimum Water
- Minimum Distance
- Free Lessons Maximum Minimum
- Minimum Wage Debate
- Minimum Sample Size


