Hi, what do you want to do?
Curated OER
Descriptive Statistics
Learners demonstrate how to use frequency and scatter diagrams. In this statistics lesson, students are introduced to different techniques of representing data. Learners sort and graph data on a worksheet and use a frequency diagram to...
Curated OER
How Many Animals?
Students use their math skills to develop estimates for the population of several animal species native to the Austrailian rainforest. It is a simulation that researchers at the Center for Rainforest Studies in Australia perform to...
Curated OER
Drops on a Penny
A helpful worksheet describes an interesting demonstration on the surface tension of water. Learners guess how many drops of water the heads side of a penny will hold. This resource does a great job of describing just how a penny can...
Curated OER
How Oceans Affect Climate
Learners draw conclusions about how the ocean affects temperature. In this weather lesson, students use the Internet to gather data to help them come to a conclusion about how the climate in a certain region is directly affected by the...
Curated OER
FLIGHT FAIR
Learners conduct their personal investigations into paper airplane flight. Cooperative teams are formed, with students choosing the paper airplane design that they are most interested in building.
Curated OER
Infusing Equity Gender into the Classroom
Students investigate if gender makes a difference in the classroom. For this statistics lesson, students collect data on whether equity by gender in the classroom makes students more successful.
Curated OER
Running The Business
In this career instructional activity, students are asked to look at the six stages necessary for the success of running a hypothetical new business.
Curated OER
Chips Ahoy A Thousand Chips In Every Bag
Sixth graders determine whether Nabico's claim to sell 1000 chocolate chips in every 1 pound bag of Chips Ahoy! is true.
Curated OER
Our Class Record Book
Second graders, in groups, prepare a list of proposed record ideas for the class book.
Texas Instruments
Texas Instruments: Glencoe Pre Algebra: Graphing Calculator: Mean and Median
Students will find the mean and median of a set of data.
Varsity Tutors
Varsity Tutors: Hotmath: Algebra Review: Mode, Mean and Median
Find a quick, concise explanation of a mode. An example is given and clearly explained. Mean and median are also explained.
National Council of Teachers of Mathematics
Nctm: Illuminations: Mean and Median
This applet allows the user to investigate the mean, median, and box-and-whisker plot for a set of data that they create.
TeachEngineering
Teach Engineering: Means, Modes, and Medians
Students experience data collection, analysis and inquiry in this LEGO MINDSTORMS NXT -based activity. They measure the position of an oscillating platform using a ultrasonic sensor and perform statistical analysis to determine the mean,...
Math Planet
Math Planet: The Mean, the Median, and the Mode
Gain an understanding of how to find the mean, median and mode by viewing examples and a video lesson. [2:22]
Missouri State University
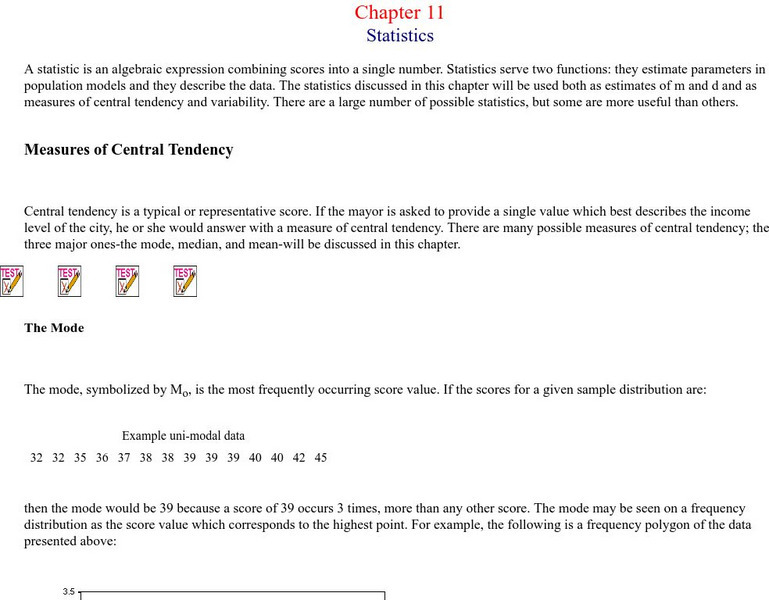
Missouri State U.: Statistics: Measures of Central Tendency and Variability
Provides lengthy explanations of the measures of central tendency - mean, mode, and median - and the measures of variability - range, variance, standard deviation. Graphs of interesting examples are presented as well, skewed...
McGraw Hill
Glencoe: Self Check Quizzes 2 Mean, Median and Mode
Use Glencoe's Math Course 2 randomly generated self-checking quiz to test your knowledge of finding the mean, median and mode. Each question has a "Hint" link to help. Choose the correct answer for each problem. At the bottom of the page...
McGraw Hill
Glencoe: Self Check Quizzes 1 Mean
Use Glencoe's randomly generated self-checking quiz to test your knowledge of finding the mean for a data set. Each question has a "Hint" link to help. Choose the correct answer for each problem. At the bottom of the page click the...
Illustrative Mathematics
Illustrative Mathematics: S Id.3 Describing Data Sets With Outliers
For certain data sets, such as home prices and household or individual income, is often described using the median instead of the mean. This lesson explores the mean and median in some different situations to help you understand the...
Cuemath
Cuemath: Mean, Median and Mode
A comprehensive guide for learning all about mean, median, and mode with definitions, the relation between them, solved examples, and practice questions.
Education Development Center
Tune in to Learning: Understanding Mean, Median and Mode
Have you ever wondered what the difference is with mean, median, and mode? Here are some exercises that will help you understand what each is.
Houghton Mifflin Harcourt
Holt, Rinehart and Winston: Homework Help Independent Practice: Measures of Central Tendency
Get independent practice working with the mean, median and mode. Each incorrect response gets a text box explanation and another try. Correct responses are confirmed.
Texas Instruments
Texas Instruments: Data and Statistical Methods 1
In this set of exercises, a set of data is provided; students answer questions about mean, median, mode, and quartiles. Questions are multiple choice with solutions provided.
Other popular searches
- Mean Median and Mode
- Mean, Median and Mode
- Mean Median Mode and Range
- Mean, Median, and Mode
- Mean, Median, Mode, and Range
- Mean, Median, Mode and Range
- Mean and Mode and Median
- Mean, Mode, and Median
- Median Mode, and Mean
- Mean, Median. Mode, and Range


