Curated OER
The Swinging Pendulum
Students observe a pendulum and graph their observation. In this algebra lesson, students use the TI calcualtor to graph the motion the pendulum makes. They analyze the graph and make predictions.
Curated OER
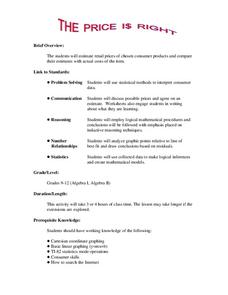
The Price Is Right
Students create a list of products with estimated prices. For this algebra lesson, students learn to write equations using variables. They match their created list with that of actual products and compare their prices,
Curated OER
Recognizing Patterns
Middle schoolers explore the concept of patterns. In this patterns lesson, students use applets to manipulate tessellations. Middle schoolers predict the next number in a sequence by recognizing patterns.
Curated OER
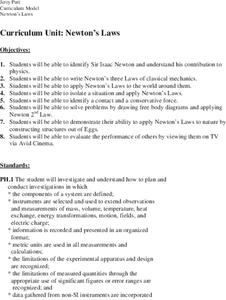
Newton's Laws
Students examine and discuss Newton's Laws and discover his contribution to physics. In groups, they participate in an experiment in which they much apply the Laws to the world around them. They describe contact and conservative forces...
Curated OER
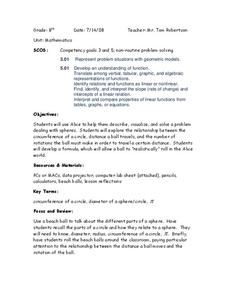
Circle Relationships
Students explore circles. In this geometry lesson, students explore the relationship between the circumference of a circle, the distance a ball travels, and the number of rotations the ball must make in order to travel a certain...
Curated OER
Exponential and Exponents Functions
Students solve problems using exponential properties. In this algebra instructional activity, students differentiate between exponents, exponential and log functions. They graph their functions using table and exponents.
Curated OER
Leaf Patterns
First graders explore the existence of patterns in everyday items. In this science and math integrated lesson, 1st graders match leaves with a name word card and organize them into four patterns. This lesson includes a reading of And the...
Curated OER
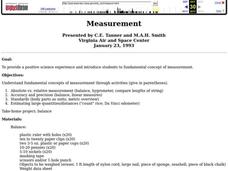
Measurement
Young scholars experience a positive science experiment and study fundamental concepts of measurement.
Curated OER
PLANETS IN PROPORTION
Students discover scales for both the solar bodies' relative sizes and their distances from the sun. They find equatorial circumference and volumes of their solar bodies. Students apply estimation strategies and proportioanl reasoning to...
Alabama Learning Exchange
The Composition of Seawater
Young scholars explore the concept of finding the composition of seawater. In this finding the composition of seawater instructional activity, students make a saturated salt water solution. Young scholars discuss why there is...
Pennsylvania Department of Education
Alike and Different
Learners compare and contrast objects and are introduced to a Venn Diagram. In this alike and different lesson, students make observations regarding properties of objects. Learners classify object and build ideas about variables....
Curated OER
Graphs and Functions
Students are introduced to plotting functions on the Cartesian coordinate plane seen several categories of functions, including lines and parabolas
Curated OER
High School Mathematics Problems from Alaska: Writing an Equation: Altitude Range vs. Day in Barrow, Alaska
High schoolers answer questions about the altitude range of the sun over time in Barrow, Alaska.
Curated OER
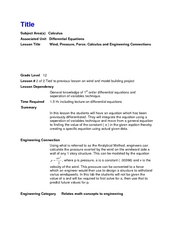
Wind, Pressure, Force, Calculus and Engineering Connections
Twelfth graders solve first order differential equations using the separation of variables technique. In this calculus lesson, 12th graders explain the connection between math and engineering. They brainstorm what engineers do in real life.
Curated OER
Flying With Mathematics!
Third graders fly miniature airplanes to discover characteristics related to velocity and average speed. After measuring the time and distance of their flights, 3rd graders calculate the average velocity of their planes.
Curated OER
Can You Dig It?
Students investigate a fossil site and diagram a site map. They role play as paleontologists.
Curated OER
Building Paper Bridges
Learners construct a bridge that can hold 100 pennies. In this math lesson, students evaluate the strength of their bridges. They predict how much weight a bridge can hold based on its design.
Texas Instruments
Texas Instruments: Linear Functions Modeled by Data
Students submit their own data that can be modeled by a linear function. Students find the line of best fit, and discuss graphs of linear functions.
Texas Education Agency
Texas Gateway: Modeling Data With Linear Functions
Given a scatterplot where a linear function is the best fit, the student will interpret the slope and intercepts, determine an equation using two data points, identify the conditions under which the function is valid, and use the linear...
TeachEngineering
Teach Engineering: Walk the Line: A Module on Linear Functions
This module leads students through the process of graphing data and finding a line of best fit while exploring the characteristics of linear equations in algebraic and graphic formats. Then, these topics are connected to real-world...
Illustrative Mathematics
Illustrative Mathematics: F Le in the Billions and Linear Modeling
In this task, learners are shown a table of world population data and asked to explore whether linear functions would be appropriate to model relationships within the data. Aligns with F-LE.A.1.b.
Illustrative Mathematics
Illustrative Mathematics: F Le Choosing an Appropriate Growth Model
The goal of this task is to examine some population data for large cities from a modeling perspective. Students are asked to decide if the population data can be accurately modeled by a linear, quadratic, and/or exponential function, and...
Khan Academy
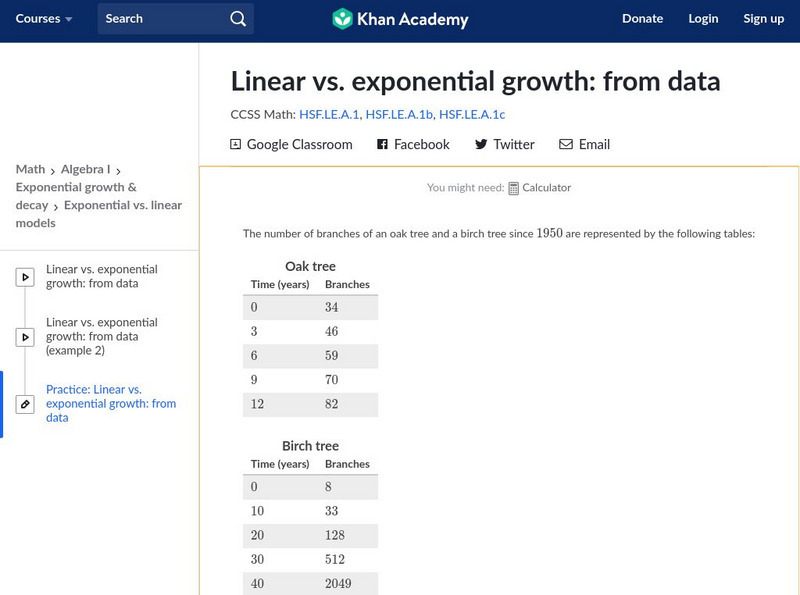
Khan Academy: Algebra I: Linear vs. Exponential Growth: From Data
Given a table with values of two quantities over time, determine whether the quantities grow linearly or exponentially. Students receive immediate feedback and have the opportunity to try questions repeatedly, watch a video or receive...
Other
Resources for Implementation: Golf Balls in Water
A lesson in which students model linear data with a linear function to solve a real-world problem.

