Curated OER
Drops on a Penny
Eighth graders experiment to determine the number of drops of water a heads up penny hold. They create a stem and leaf graph of the class results and use the data for further experimentation on a tails up penny.
Curated OER
da Vinci: Body Proportion Theories
Middle schoolers investigate the validity of da Vinci's proportion theory by recording human measurements on scatter plots. In groups of three, they record each other's height and wingspan to create a Powerpoint presentation, chart, or...
Inside Mathematics
Scatter Diagram
It is positive that how one performs on the first test relates to their performance on the second test. The three-question assessment has class members read and analyze a scatter plot of test scores. They must determine whether...
Teach Engineering
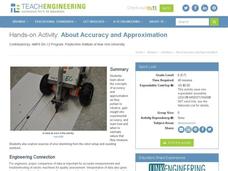
About Accuracy and Approximation
How accurate are robots? Groups draw lines by moving robots backwards and forwards by one rotation of the wheels. Using the appropriate formula, they determine the percent error in the length of the lines in relation to the calculated...
Curated OER
To Be Linear or Not to be Linear, That is the Question
Students use their knowledge and understanding of equations of lines to explore independent and dependent variables. They determine how to isolate a variable and how to predict data points not represented in data.
Curated OER
Who's got the fastest legs?
Students use a stopwatch to collect information for a scatterplot. In this fastest legs lessons, students collect data through the taking of measurements, create and find a median number. Students develop an equation and answer...
Curated OER
Handling Data: Representing Date - Online Version
Here is an online lesson plan on data representation. In it, learners access websites embedded in the plan which lead them through a variety of activities around data representation and statistics. The activities are quite good, and...
Curated OER
Leonardo da Vinci
Students select appropriate tools and technology to perform tests, collect data, and display data. They construct appropriate graphs from data and develop qualitative statements about the relationships between variables.
Curated OER
Making Choices
Second graders explore financial decision making. In this introductory economics lesson, 2nd graders listen to the book Alexander, Who Used to be Rich Last Sunday by Judith Viorst, and discuss making financial choices based on wants and...
Curated OER
Does Music Cam the Savage Beast?
Students collect, graph and analyze data. For this statistics lesson, students measure the heart beat of a person as they listen to music. They use the CBL and TI to create a graph, analyzing the outcome.
Curated OER
Math Jeopardy: Basic Skills
Students play a PowerPoint activity to be used as a review of basic skills for order of operations, and the operations of addition, subtraction, multiplication, and division for whole numbers, some fractional numbers and integers....
Curated OER
Earning an Income
Fourth graders study the role of money in society and define how to earn an income. In this human capital lesson, 4th graders read the book Shoeshine Girl and discuss it. Students discuss various economic concepts and complete the...


