Charleston School District
Solving Equations with the Distributive Property
Now there are parentheses in these equations? As the lessons continue in this series, equations get progressively more complex. Eighth graders solve equations by applying the distributive property before using inverse operations.
Teach Engineering
Slinkies as Solenoids
What does an MRI machine have to do with a slinky? This activity challenges learners to run a current through a slinky and use a magnetic field sensor to measure the magnetic field. Groups then change the length of the slinky to see...
EngageNY
Base 10 and Scientific Notation
Use a resource on which you can base your lesson on base 10 and scientific notation. The second installment of a 35-part module presents scholars with a review of scientific notation. After getting comfortable with scientific...
EngageNY
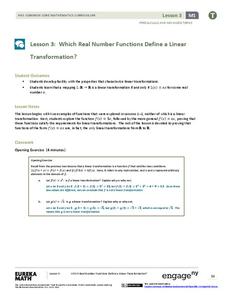
Which Real Number Functions Define a Linear Transformation?
Not all linear functions are linear transformations, only those that go through the origin. The third lesson in the 32-part unit proves that linear transformations are of the form f(x) = ax. The lesson plan takes another look at examples...
Inside Mathematics
Snakes
Get a line on the snakes. The assessment task requires the class to determine the species of unknown snakes based upon collected data. Individuals analyze two scatter plots and determine the most likely species for five...
EngageNY
Getting a Handle on New Transformations 2
Use 2x2 matrices to move along a line. The second day of a two-day instructional activity is the 28th installment in a 32-part unit. Pupils work together to create and solve systems of equations that will map a transformation...
EngageNY
Law of Cosines
Build upon the Pythagorean Theorem with the Law of Cosines. The 10th part of a 16-part series introduces the Law of Cosines. Class members use the the geometric representation of the Pythagorean Theorem to develop a proof of the Law of...
EngageNY
The Graph of a Linear Equation in Two Variables Is a Line
Show your class that linear equations produce graphs of lines. The 20th segment in a unit of 33 provides proof that the graph of a two-variable linear equation is a line. Scholars graph linear equations using two points, either from...
EngageNY
Sampling Variability and the Effect of Sample Size
The 19th installment in a 25-part series builds upon the sampling from the previous unit and takes a larger sample. Pupils compare the dot plots of sample means using two different sample sizes to find which one has the better variability.
EngageNY
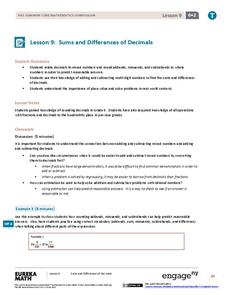
Sums and Differences of Decimals
Sometimes dealing with decimals is so much easier than dealing with fractions. The ninth lesson in a 21-part module has the class consider situations when it might be easier to add or subtract fractions by first converting to...
EngageNY
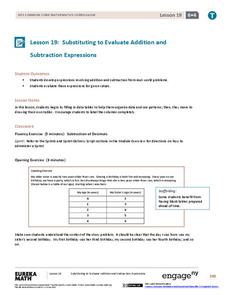
Substituting to Evaluate Addition and Subtraction Expressions
Substitute this resource for what you used to use. Learners identify patterns in data tables and write addition and subtraction expressions to represent relationships. Substitution allows them to solve problems in context in the 20th...
EngageNY
Writing and Evaluating Expressions—Multiplication and Addition
How many people can sit around a table? The 22nd part in a series of 36 continues the work on writing and evaluating expressions to include expressions with two operations. Pupils use models to determine an expression for the number of...
EngageNY
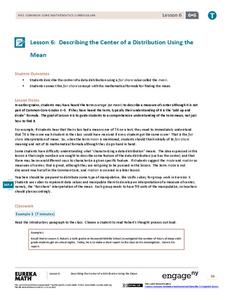
Describing the Center of a Distribution Using the Mean
Everyone does their fair share. The sixth segment in a 22-part unit presents the mean as a fair share. Groups build a conceptual understanding of the mean of a data set, rather than simply learn an algorithm. Learners use the...
EngageNY
The Mean as a Balance Point
It's a balancing act! Pupils balance pennies on a ruler to create a physical representation of a dot plot. The scholars then find the distances of the data points from the balance point, the mean.
EngageNY
Understanding Box Plots
Scholars apply the concepts of box plots and dot plots to summarize and describe data distributions. They use the data displays to compare sets of data and determine numerical summaries.
EngageNY
Writing and Evaluating Expressions—Exponents
Bring your young mathematicians into the fold. Scholars conduct an activity folding paper to see the relationship between the number of folds and the number of resulting layers in the 23rd installment of a 36-part module. The results of...
EngageNY
One-Step Equations—Multiplication and Division
Discover one more step to being able to solve any one-step equation. Scholars continue their work with one-step equations in the 28th installment of a 36-part module. Tape diagrams and algebraic processes introduce how to solve one-step...
EngageNY
Connecting Graphical Representations and Numerical Summaries
Which graph belongs to which summary statistics? Class members build upon their knowledge of data displays and numerical summaries to connect the two. Pupils make connections between different graphical displays of the same data in...
EngageNY
Describing Center, Variability, and Shape of a Data Distribution from a Graphical Representation
What is the typical length of a yellow perch? Pupils analyze a histogram of lengths for a sample of yellow perch from the Great Lakes. They determine which measures of center and variability are best to use based upon the shape of the...
EngageNY
Summarizing a Data Distribution by Describing Center, Variability, and Shape
Put those numbers to work by completing a statistical study! Pupils finish the last two steps in a statistical study by summarizing data with displays and numerical summaries. Individuals use the summaries to answer the statistical...
CPM
Cones and Spheres
Geometry whizzes solve and complete 24 different problems that include determining the volume and surface area of spheres and cones. First, they use the given information to determine the volume of a cone. Then, pupils use the given...
Illustrative Mathematics
Should We Send Out a Certificate?
Fred thinks his test score is high enough to earn him a certificate. Given the mean and standard deviation, use properties of normal distributions to calculate Fred's percentile ranking and see if he is right. Consider having your class...
Curated OER
Solving Linear Inequalities
Walk the class through the steps of how to evaluate linear inequalities in one variable and graph the solution set. Define and discuss key vocabulary terms, then have individuals work problems of varying difficulty. Included are word...
Illustrative Mathematics
The Marble Jar
A jar is filled with 1,500 marbles and customers of a bank can enter a contest to guess the correct percentage of blue marbles. How can an employee at the bank estimate the actual percentage without physically counting all 1,500 marbles?...
Other popular searches
- Music Note Values
- Beginning Music Note Values
- Musical Note Values
- Rhythm & Note Values
- Teaching Note Values
- Note Values in Music
- Learning Note Values
- Note Values Worksheet
- Sixteenth Note Values
- Reading Music Note Values
- Note Values and Rhythm
- Dotted Note Values


