Curated OER
Correlation of Variables by Graphing
Middle and high schoolers use a spreadsheet to graph data. In this graphing lesson, learners determine how two parameters are correlated. They create a scatter plot graph using a computer spreadsheet.
EngageNY
Interpreting Correlation
Is 0.56 stronger than -0.78? Interpret the correlation coefficient as the strength and direction of a linear relationship between two variables. An algebra lesson introduces the correlation coefficient by estimating and then...
Curated OER
Rolling Number Sentences
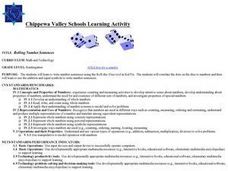
Budding mathematicians investigate how to write number sentences using the Roll-the-Dice tool in "Kid Pix". They correlate the dots on the dice to numbers and then learn to use the addition and equal symbols to write number sentences....
American Statistical Association
EllipSeeIt: Visualizing Strength and Direction of Correlation
Seeing is believing. Given several bivariate data sets, learners make scatter plots using the online SeeIt program to visualize the correlation. To get a more complete picture of the topic, they research their own data set and perform an...
West Contra Costa Unified School District
Correlation and Line of Best Fit
Computers are useful for more than just surfing the Internet. Pupils first investigate scatter plots and estimate correlation coefficients. Next, they use Microsoft Excel to create scatter plots and determine correlation...
Project Maths
Correlation Coefficient
Of course, there might be a correlation! Young mathematicians investigate several different data sets, create scatter plots, and determine any correlation. They consider whether a causation exists between any of the variables in question.
Curated OER
Investigating Correlation
High schoolers investigate different types of correlation in this statistics lesson. They identify positive, negative and no correlation as it relates to their data. They then find the line of best fit for the plotted data.
Curated OER
Barbie Bungee
Middle and high schoolers collect and analyze their data. In this statistics lesson, pupils analyze graphs for linear regression as they discuss the relationship of the function to the number of rubber bands and the distance of the...
Curated OER
Linear Regression and Correlation
Learners explore scatter plots. In this linear regression lesson, groups of pupils graph scatter plots and then find the line of best fit. They identify outliers and explain the correlation. Each group summarizes and shares their...
Curated OER
And Then One Night, The Making of Dead Man Walking: Classroom Content
High schoolers examine how art and music help to define and unify a social movement and also how they can function as symbols of protest. They watch KQED program And Then One Night: The Making of Dead Man Walking and discuss what happens...
Curated OER
Two-Cell Battery
Students build their own two-cell battery and determine which electrolyte solution is best suited for making a battery. They discuss background information for their experiment, construct and test their battery, and using the chart on...
Statistics Education Web
The United States of Obesity
Mississippi has both the highest obesity and poverty rate in the US. Does the rest of the data show a correlation between the poverty and obesity rate in a state? Learners tackle this question as they practice their skills of regression....
Curated OER
Correlative Conjunctions
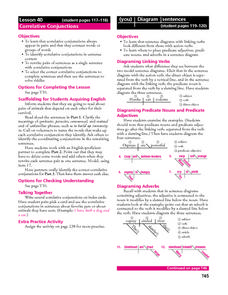
Learners identify correlative conjunctions in sentences and then rewrite pairs of sentences as a single sentence with correlative conjunctions. They practice diagramming sentences of various sentence patterns and then write a personal...
Curated OER
K-1 Numeral Recognition
Students investigate numerals by creating visual aides. In this number sense lesson plan, students discuss the different types of numerals and how they can be translated into a number or an image. Students create a children's...
Curated OER
ADDING ON THE NUMBER LINE ACCENTUATING THE NEGATIVE
Seventh graders solve problems involving addition of positive and accentuating negative integers. In this adding real numbers lesson, 7th graders draw a number line on chart paper, complete a working sheet and use the Learning Gizmo...
Curated OER
Conjunction Recognition Practice
What is a coordinating conjunction, and how is it different from a correlative conjunction? First, study the three types of conjunctions. There are descriptions and examples included to help you do this. Then, release your kids for some...
Centers for Disease Control and Prevention
Being the “Host” at This Party is No Fun
Discuss the symptoms and variations from infectious diseases from one person to the next. After a class discussion, small groups complete research on the topic.
Curated OER
Devising a Measure for Correlation
How well does your class understand the concept of correlation? Use an activity to explore different methods of calculating correlation. Working alone and then in groups, your class will make decisions on what math to apply to the...
Curated OER
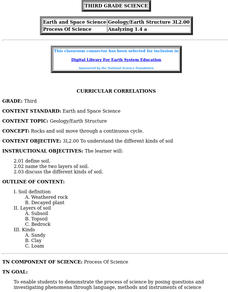
Curricular Correlations
An interesting lesson on different types of soils is here for you. In it, learners discuss what soil is, and consider three piles of soil - clay, sand, and loam. During the rest of the lesson, third graders discover all sorts of...
Centers for Disease Control and Prevention
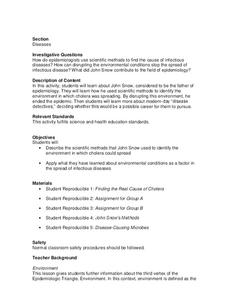
Diseases
During a cholera outbreak, scientists presented two theories; one theory was based on miasma and the other on germs and contaminated water. The lesson looks at the scientific process for finding the real culprit.
Mathalicious
Pic Me!
Finally! Math and Instagram have come together to discuss the correlation between likes and followers. High schoolers can't help but want to discover what makes one account more popular than another by developing a line of best fit and...
Mascil Project
Sports Physiology and Statistics
If I want to build up my heart, where should I start? Science scholars use statistics in a sports physiology setting during an insightful experiment. Groups measure resting and active heart rates and develop a scatter plot that shows the...
Curated OER
Introduction to Correlations
Learners investigate correlations between human body height and other human features. They select ten subjects and record each subject's age and gender and measure for height, wingspan, distance, and size of hands. After measuring, they...
Curated OER
Correlate This!
Students investigate different correlations. In this algebra lesson, students analyze graphs and identify the lines as having positive, negative or no correlation. They calculate the line of best fit using a scatter plot.


