EngageNY
Why Do Banks Pay YOU to Provide Their Services?
How does a bank make money? That is the question at the based of a lesson that explores the methods banks use to calculate interest. Groups compare the linear simple interest pattern with the exponential compound interest pattern.
Institute of Electrical and Electronics Engineers
Arduino Blink Challenge
Emerging engineers read about Arduino software and how it can be used. Then they follow a nine-step tutorial to connect an Arduino board to a computer and put it to work! The objective is to code a program that will cause an LED to...
West Contra Costa Unified School District
Indefinite Integrals
The inverse of matter is anti-matter, so the inverse of a derivative is an antiderivative. The lesson introduces antiderivatives and indefinite integrals to the class along with the notation for integrals. Groups work together to find...
Howard County Schools
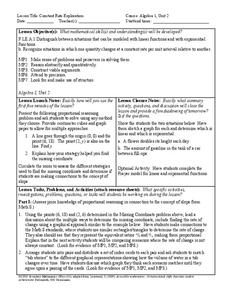
Constant Rate Exploration
Question: What do rectangles and bathtub volume have in common? Answer: Linear equations. Learn how to identify situations that have constant rates by examining two different situations, one proportional and one not proportional.
Curated OER
More Bait for Your Buck!
Students determine where to buy the heaviest earthworms as they study invertebrates. They create a double bar graph of the results of the weight data.
Curated OER
Cannonball
Young scholars calculate the speed, motion and distance of a projectile. In this geometry lesson, students obtain measurements while calculating velocity. They graph their results and make predictions.
Curated OER
Earthquake Epicenters and Magnitudes
Pupils work on a virtual earthquake to increase their understanding of seismograms, earthquake epicenters, Richter Magnitude and triangulation when finding the epicenter of an earthquake.
Curated OER
Science: Observing Fish Behavior
Fifth graders, working in pairs, select and observe fish in the Aquademics aguarium. They record their observations on worksheets and make graphs displaying the frequency of various fish behaviors. Students then discuss their...
Curated OER
An Enzyme- Substrate Model
Students explore reaction rates of an enzyme-mediated reaction. They examine the effects of environmental variables on enzyme function. Students collect, graph, and analyze data relating to the reaction.
Curated OER
Shadows
Students conduct an experiment. For this shadows lesson, students record the height of a meter stick. Students then cast shadows and record their length. Students compare the length of the shadow with the actual height of the meter stick.
Curated OER
Santa's workshop
Young scholars are split up into groups of 3-4 kids, they write one story problem for each catagory: Santa's workshop, Reindeer Barn, Mrs. Claus' Kitchen. They read their story probems to the class and award points to the other teams for...
Curated OER
Linear Functions
Students solve and graph linear equations. In this algebra lesson, students collect data and plot it to create a linear function. They identify the domain and range of each line.
Curated OER
The Little Ice Age - Understanding Climate and Climate Change
Fourth graders receive data about tree ring records, solar activity, and volcanic eruptions during the Little Ice Age (1350-1850). From this data, they draw conclusions about possible natural causes of climate change
Curated OER
Creating Line Graphs
Pupils draw line graphs. In this math lesson, students interpret minimum wage data and graph the data in a line graph. Pupils predict the next minimum wage and figure the earnings for a 40 hour work week for someone earning the minimum...
Curated OER
Risky Business
High schoolers view a video on AIDS, HIV and the ways in which HIV is spread. They discuss ways to avoid contracting HIV and participate in a simulation that shows the growth of a communicable disease.
Curated OER
Rock Eater
Young scholars examine the effects of acid rain by
performing a simulation experiment. They also view the
effects of acid rain and erosion on the reservation and record observations in a science log.
Curated OER
Impulse/Momentum Lab
Students investigate the relationship between force and momentum using motion detectors and sensors. In this physics lesson, students graph experimental results. They calculate impulse using the area under the graph.
Curated OER
Perplexing Puzzles
Elementary and middle schoolers explore scatter plots. In this graphing lesson, pupils work in small groups and use jigsaw puzzles to develop a scatter plot. Younger students may develop a bar graph.
Curated OER
Cardiac Function
In this health worksheet, students look for the connections needed to attain the knowledge of cardiac function. The sheet includes the background information.
Curated OER
School Yard Waste
Fourth graders examine the types of garbage that they collect on the playground. They collect the information in a spreadsheet and create a graph that displays the number of types of trash found. They design and monitor a playground...
Curated OER
Book Buffet
Students are encouraged to develop a love for reading by sampling different types of literature. They are encouraged to read one of the books that is sampled. The sample should be challenging for the reader without causing discouragement.
Curated OER
Worksheet 2 - Instantaneous Velocity
In this distance worksheet, students determine the distance between two objects, find the average velocity of an object, and define instantaneous velocity. This two-page worksheet contains six two-step problems.
Illustrative Mathematics
Accuracy of Carbon 14 Dating I
Here is an activity that is intended to highlight a very important issue about precision in reporting and understanding statements in a realistic scientific context. Discuss different ways of reporting the half life of Carbon 14...
Curated OER
My Community: Then and Now
Students compare and contrast their community to what it was like 50 years ago. They research various aspects of their community and compare and contrast with what it is like now. Students present and discuss their findings.


