Curated OER
Can you Find the Expression
Young scholars collect data from measurements and weights for this experiment. In this algebra lesson, students analyze graphs they create form their data to find the expression representing the data. They label which graph provided the...
Curated OER
Virtual Field Trip: Lodging and Meals
Students calculate the costs for lodging and meals for a virtual field trip. They calculate the number of nights lodging needed for road and city travel and the number of meals needed, the costs for each, and input the data using...
Curated OER
Assessing Normalcy
Students define normal distribution as it relates to the bell curve. In this statistics lesson, students use the central tendencies of mean, median and mode to solve problems. They plot their data and draw conclusion from the graphs.
Curated OER
The Nature and Science of Technology
Fifth graders practice using the scientific method by observing and creating mold. In this bacteria lesson, 5th graders experiment creating their own mold and fungus using petri dishes and oatmeal. Students create an information table...
Curated OER
Introducing Linear Terminology
Ninth graders graph linear equations and inequalities in two variables and then, they write equations of lines and find and use the slope and y-intercept
of lines. They use linear equations to model real data and define to define the...
West Contra Costa Unified School District
Correlation and Line of Best Fit
Computers are useful for more than just surfing the Internet. Pupils first investigate scatter plots and estimate correlation coefficients. Next, they use Microsoft Excel to create scatter plots and determine correlation coefficients and...
Curated OER
Regressive Music
Student use the Ti calculator to graph sinusoidal graphs. In this calculus lesson, students use the CBL to collect and analyze data of sinusoidal graphs. They manipulate their collected data and make predictions.
Curated OER
Curve Ball
Create a Height-Time plot of a bouncing ball using a graphing calculator. Graph height as a function of time and identify the vertex form of a quadratic equation that is generated to describe the ball's motion. Finally, answer questions...
Curated OER
Purchasing A Used Car
Seventh graders investigate the practice of purchasing a used car with the help of links and resources found in the lesson plan. They conduct research to find the right kind of car using a variety of resources. Students examine data in...
Curated OER
What Are The Chances
Students calculate the probability of an event occurring. In this probability instructional activity, students differentiate between independent, dependent or compound events. They find the range of the data.
Curated OER
STRETCHING SPRING
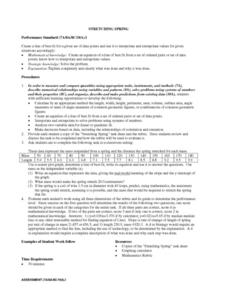
Students calculate the length, width, height, perimeter, area, volume, surface area, angle measures or sums of angle measures of common geometric figures. They create an equation of a line of best fit from a set of ordered pairs or...
Curated OER
Translating Words to Algebraic Expressions
Seventh graders translate word sentences to algebraic expressions. In groups of three, 7th graders determine the number of times their heart beats in fifteen seconds. Using this data, they calculate the heartbeats per minute, in five...
Curated OER
Rocketsmania And Slope
Learners use a professional basketball team's data and graph it on a coordinate plane. They draw a line of regression and finding its equation. They access a website containing statistics for the Houston Rockets basketball team to solve...
Curated OER
Exploring Function Graphs
Tenth graders investigate three different sets of data that relate temperature to another variable in the physical world. These illustrate linear, inverse and exponential relationships.
Curated OER
Math: Will The Airplane Get Off the Ground?
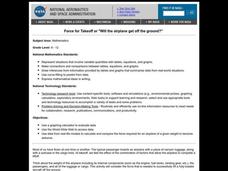
Students use data from real-life models to calculate and compare the force required for an airplane of a given weight to become airborne. They use a graphing calculator to evaluate data and use the World Wide Web to access data.
Curated OER
Quiz: Scatter Plots and Line of Best Fit
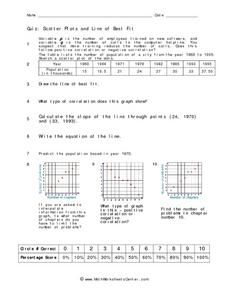
In this scatter plots and line of best fit activity, students create scatter plots from given sets of data. They answer questions concerning the scatter plot. Students write the equation of a line, identify the type of correlation...
Curated OER
Least Squares Fit Line
Students estimate the least squares fit line for a set of data. They understand error involved in least square fit lines. They solve application problems using least square fit lines.
PBS
Working with Coordinate Planes: Assessments
It's time for scholars to show what they know about coordinate planes with a collection of three assessments. The exams' objectives include plotting points on a single grid, measuring using the distance formula, and identifying points on...
Curated OER
More Students Taking Online Courses
In this graph worksheet, students study a bar graph that shows the number of college students taking at least one online course. Students answer 4 problem solving questions about the data on the graph.
Teach Engineering
The Fibonacci Sequence and Robots
What better way to introduce the idea of a sequence than with robots! An educational instructional activity explains the classic Fibonacci sequence before pupils build and program a robot to move. Additionally, the instructional activity...
Pennsylvania Department of Education
Alike and Different
Students compare and contrast objects and are introduced to a Venn Diagram. In this alike and different lesson plan, students make observations regarding properties of objects. Students classify object and build ideas about variables....
Curated OER
Pizza Topping Combinations
Students brainstorm pizza toppings and determine the number of possible ways to order a pizza. In this algebra lesson, students analyze and investigate geometric patterns as they relate to the concept of a variable. Students then use a...
Curated OER
Function Tables
In this function tables activity, students analyze 6 different function tables to determine the rule that applies to each table. The data in the table involves 2 variables and the rule is either addition, subtraction, multiplication...
Curated OER
Functions As Graphs Worksheet
In this math worksheet, young scholars graph the data given in the organizer. The functions are used to create the new line for finding the possible unknowns.


