Noyce Foundation
Granny’s Balloon Trip
Take flight with a fun activity focused on graphing data on a coordinate plane. As learners study the data for Granny's hot-air balloon trip, including the time of day and the distance of the balloon from the ground, they practice...
Curated OER
Using Matrices for Data
For this matrices for data worksheet, 9th graders solve and complete 29 various types of problems that include using matrices to illustrate data. First, they determine the sum, difference and scalar product for each matrices shown. Then,...
Curated OER
Use or Make a Table
In this use or make a table worksheet, young scholars examine data given in a story problem. They use logic to determine the best way to begin organizing the data and creating a table. This one-page worksheet contains three problems. ...
Illustrative Mathematics
Speed Trap
In which direction is traffic moving faster, north or south? Use box and whisker plots to organize data and interpret the results. Detailed solutions are included. This activity would be good as a warm up or quick assessment at the end...
Curated OER
Interpreting Your Data
In this water quality sampling worksheet, students organize and analyze their data from samples they have collected. After analyzing based on 9 guide questions, they complete 18 short answer questions about fish, benthic, and plant...
Curated OER
Organize Your Favorites (Food)
In this healthy foods worksheet, pupils organize the names nutrient-rich foods into categories. Students also read passages about nutrition and respond to three short-answer questions.
Curated OER
Organizing Data
In this tally chart activity, learners complete a tally chart of the number of each animal they see in the picture and answer short answer questions about it. Students complete the chart for 5 animals and answer 3 questions.
Curated OER
Graphing Activity
In this probability and statistics learning exercise, students work with a family member to construct graphs based on real life data. The two page learning exercise contains three questions. Answers are not included.
Curated OER
Bluebirds Project
In this bluebirds project activity, students are given directions on completing a project about bluebirds including measurements, scientific method questions, data entry, and more. Students complete 15 exercises.
Curated OER
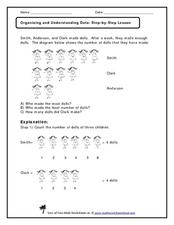
Organizing and Understanding, Step-by-Step
Use this number comparison and counting worksheet as an overhead projection for the whole class, because the answer is explained on the bottom half of the sheet. Cover the answer and reveal it once learners have tried it themselves. They...
Balanced Assessment
The Triskaidecaphobia Conference
Triskaidecaphobia is an extreme superstition to the number 13—and ironically the answer to the word problem is 13! Presented with a series of descriptive data, individuals analyze the data to determine the population size. They must...
Curated OER
Family Size
In this family size worksheet, students complete a tally chart to determine data from a family size line plot. They organize the data in the chart to determine the mean, median, mode, and range of the data. There are six problems in...
Curated OER
Long Distance Phone Plans
In this long distance phone plane worksheet, young scholars compare various phone plans and determine which long distance plan has the greatest savings. Students support their answers visually through the use of tables and graphs. They...
EngageNY
Presenting a Summary of a Statistical Project
Based upon the statistics, this is what it means. The last lesson in a series of 22 has pupils present the findings from their statistical projects. The scholars discuss the four-step process used to complete the project of their...
Math Mammoth
Bar Graphs 1
In this bar graph activity, students organize data in a frequency table, then create a bar graph. They find the average of the data. This one-page activity contains two multi-step problems.
Curated OER
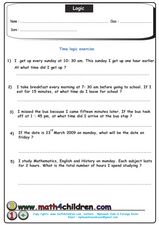
Logic
For this logic worksheet, students read logic puzzles. They use tables and Venn diagrams to organize data and determine the answer to the question. This ten-page worksheet contains 16 problems. Answers are provided on the last half of...
University of Georgia
Energy Content of Foods
Why do athletes load up on carbohydrates the evening before a competition? The lesson helps answer this question as it relates the type of food to the amount of energy it contains. After a discussion, scholars perform an experiment to...
Curated OER
Organizing and Understanding data - Guided Lesson Explanations
A teacher resource, this scripted lesson details how to explain to learners the steps involved in determining the total number of objects in a category, how many of each type, and how many more or less are in one category than in...
Curated OER
Drops on a Penny
Young scientists explore the concept of surface tension at is applies to water. In this activity, learners use a dropper to place drops of water on a penny. Each group guesses how many drops a heads-up penny will hold, then conducts the...
Mathed Up!
Two Way Tables
When presented with categorical data, a two-way frequency table is a great way to summarize the information. Pupils organize categorical data using a two-way table, then use the tables to determine missing data and to calculate simple...
Howard Hughes Medical Institute
Color Variation over Time in Rock Pocket Mouse Populations
A species-specific look at natural selection, the resource herein examines how adaptations have helped the population of rock pocket mice survive in a changing landscape. To begin, middle or high schoolers watch a 10.5 minute video,...
Curated OER
Light Stick Chemistry
In this descriptive investigation worksheet, 6th graders conduct an investigation to determine if heat energy affects the brightness of a light stick. The students will form a prediction, collect data and answer 3 conclusion questions.
Curated OER
1-4 Study Guide Integration: Statistics Stem-and-Leaf Plots
In this statistical worksheet, students organize given data into a stem-and-leaf plot. They then use their organize data to answer given questions. Students create two stem-and-leaf plots and answer five questions. An answer sheet is...
EngageNY
Developing a Statistical Project
The 17th lesson in a unit of 22 presents asks the class to conduct a statistics project. Pupils review the first two steps of the process of asking a question and collecting data. They then begin the process by developing a statistical...


