Curated OER
Data Analysis, Probability, and Statistics: Exploring Websites
Students measure their pulse rates and place the number on the board. They arrange the numbers in order and discuss the differences between isolated facts and data. Students explore websites that relate to data analysis and report their...
Curated OER
"Graph It"
Students work in teams to conduct short surveys of their classmates. They show their results using at least two different types of graphs.
Students separate into teams and are asked that each team to choose something that they are...
Curated OER
Science and Technology
Students research inventions that have been created. In this historical technology lesson, students read the Harcourt Brace social studies textbook and discuss how inventors used graphs to display data. Students create a table to write...
Curated OER
Mr. Cobbler's Shoe Dilemma
Students employ statistics to solve real-world problems. They collect, organize and describe data. They make inferences based on data analysis. They construct, read, and interpret tables, charts and graphs.
Curated OER
Graphic Favorite Breakfast Foods
Second graders graph data based on a class survey of their favorite breakfast foods. In this graphing lesson plan, 2nd graders take a class survey of their favorite breakfast foods. Then they take that data and put it into a computer...
Curated OER
Pika Chew
Students work in collaborative teams with specific roles, use the Internet to research the behavior and ecology of pikas, make predictions about survival rates of pikas in different habitats and organize their data in graphs.
Curated OER
Tall Tale Rollers
Students explore American tall tales. In this tall tale lesson, students discover the six characteristics that are included in tall tales. Students survey their class to find each student's favorite tall tale character and organize the...
Curated OER
WebQuest: Thrills and Spills- Pick Your Park!
Students participate in a WebQuest in which they must determine which amusement park is the "median priced" park. Students visit park websites to accumulate prices for parking, activities, restaurants, and gift shops.
Curated OER
Bird Feeding and Migration Observation
Students research bird migration and build a bird house. In this bird lesson plan, students research the birds in their area and where they migrate to. They also build their own bird house and record data on what kinds of birds come to...
Curated OER
What's Your Line?
Fifth graders collect temperature readings over a period of time, enter the information into a spreadsheet and choose the appropriate graph to display the results.
Curated OER
Graphing Favorite Holidays
Young scholars create spreadsheets and bar graphs based on results of survey of favorite holidays.
Curated OER
Mapping River Statistics
High schoolers research different statistics to do with the Mississippi River. They answer questions about finding data and collect it by conducting research. The research is used to construct a data table. Then students use the table to...
Curated OER
Student Heights
Learners measure the heights of their fellow classmates and create a box and whisker plot to display the data. In this measurement lesson plan, students analyze the data and record results.
Curated OER
SkittleGraphs
Second graders discover how to make a bar graph. Each student receives a bag of Skittles candy. They make a bar graph which documents the colors found in the bag. At the end of the lesson, the Skittles are eaten. Fun!
Curated OER
What is a Box and Whisker Plot?
Eighth graders explore the correct use of box and whisker plors. The times when they are appropriate to use to compare data is covered. They plot data according to statistical analysis including mean, median, and mode.
Curated OER
Variation
In this variation worksheet, students interpret and organize data. They find the distance between points. Students use ratios to determine volume This six-page worksheet contains approximately 20 problems. Answers...
Curated OER
Graphing With RXTE
Learners use data from the Rossi X-ray Tiiming Explorer (RXTE) satellite to analyze and graph.
Curated OER
Can You Measure Up?
Here is a well-designed lesson on common standards of measurement for your young mathematicians. In it, learners calculate measurements in standard and non-standard units. They make predictions, record data, and construct and design...
Curated OER
Making Money and Spreading the Flu!
Paper folding, flu spreading in a school, bacteria growth, and continuously compounded interest all provide excellent models to study exponential functions. This is a comprehensive resource that looks at many different aspects of...
Curated OER
Quarter, Nickel, Dime....
An engaging game called, "Quarter, Nickel, and Dime" is presented in this math lesson. Players are given an envelope with slips of paper that represent the three coins. In pairs, they play the game 18 times, and the whole class charts...
Cheetah Outreach
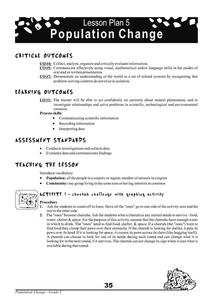
Population Change
Your youngsters become cheetahs in search of food, water, shelter, and space in a fun physical game that does a fantastic job of representing fluctuating species population based on resources available over years.
National Security Agency
It's Probably Probable
Learners make predictions and draw conclusions from given information as they learn the meaning of probability in this vocabulary-rich, integrated activity that presents a variety of teaching strategies to motivate and reach...
Curated OER
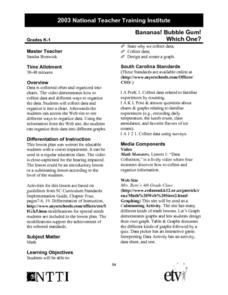
Bananas! Bubble Gum! Which One?
Students design and create a graph of data they have collected on their favorite candy bars. They explore how to organize data as well.
Curated OER
You mean college costs that much?
Seventh graders collect, organize, and analyze data as they research colleges on the Internet. They graph their collected data on a line graph and use a spreadsheet on Microsoft Excel in order to organize the data.


