Curated OER
Plotting with Pennies
Fifth graders use pennies to gather data, organize and order data, graph the data on a stem-and-leaf plot, and evaluate the range, median, and mode of the data.
Curated OER
3-D Beginning Graphs
Students explore the concept of big and small. They collect objects from the classroom, sort them by size, and create a graph using Duplo stacking blocks.
Curated OER
Getting Ready for Success
Third graders review the poem and activity from the previous session and then work in groups of four to tape skill strips in the appropriate category on a Venn Diagram. Next, a spokesperson from each group gives a report summarizing...
Curated OER
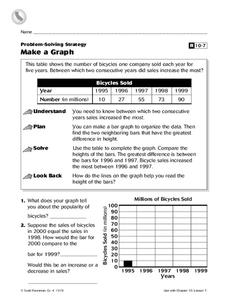
Make a Graph
In this graphs worksheet, 4th graders, after studying and analyzing a table on bicycles sold within several years, answer 2 short answer questions relating to the table.
Curated OER
Math Investigations 2
Young mathematicians practice measuring and graphing skills while working in groups to measure objects found in the classroom. Using their measurements, they create one bar graph displaying the lengths and another displaying the widths.
Curated OER
My Four to Six Year Plan (My Personal Plan of Study)
Eighth graders examine what they need to do to meet their career goals. They design a four to six year plan for the classes they need to take in high school after listening to high school mentor tell about their experiences with this...
Curated OER
I'm Out of Here
Students create a travel budget. In this budget lesson, students research vacation destinations. Working independently, students research destinations on the Internet and construct a budget for the vacation. Resources provided.
Curated OER
Pen Pals
Students collect bird count data at their sites, and share and compare the data collected from two different schoolyards using computer technology.
Curated OER
Line 'Em Up!
Young scholars find coordinate points on a grid and create a line graph with those points. This lesson should ideally be used during a unit on various types of graphs. They make and use coordinate systems to specify locations and to...
Curated OER
Fast Food: You Can Choose!
Students research the nutritional value of fast food. They assess which fast foods are best and worst to eat. They organize their data into tables and graphs and explain their findings to other students.
Curated OER
Building Storm Shelters
Sixth graders explore area and perimeter. In this online interactive area and perimeter instructional activity, 6th graders investigate why the perimeter of rectangles can vary considerably even when the area is held constant. Students...
Curated OER
One Hundred Hungry Ants
Primaries read the book One Hundred Hungry Ants and solve word problems based on the book. In this word problems lesson plan, students will be able to find the factors of a number by organizing counters into equal rows.
Curated OER
What Do I Want To Be When I Grow Up?
Students divide careers into clusters. In this vocational technology lesson, students prepare a PowerPoint presentation of one of the six career clusters. Working in small groups, students organize a variety of careers into...
Curated OER
Make a Tally
In this tally chart learning exercise, students read the word problems and use the information within the problem to make a tally chart. Students use the tally charts to help them finish and solve the word problem.
Curated OER
Evidence of Change Near the Arctic Circle
Learners analyze graphs and make conclusions about climate change. In this climates lesson students produce graphs and identify relationships between parameters.
Curated OER
The Great Turkey Walk
Students formulate questions that can be addressed with data and collect, organize, and display relevant data to answer them. They wcreate bar graphs and pie graphs
Curated OER
TE Activity: A Tornado in My State?
Students study data about tornadoes in the United States while completing a worksheet. They develop a bar graph showing the number of tornadoes for the top ten states in the US. They find the median and mode of the data set.
Curated OER
Real Estate Lesson: Monthly Payments
Students examine real-world data relating to real estate. They conduct Internet research, record data regarding real estate in major cities, graph the data, calculate mortgage payments using a mortgage calculator, and analyze the data.
Curated OER
Drops on a Penny
Young scientists explore the concept of surface tension at is applies to water. In this activity, learners use a dropper to place drops of water on a penny. Each group guesses how many drops a heads-up penny will hold, then conducts the...
Curated OER
Investigating the Probability
Students investigate probability using coins and dice. They collect data, graph, organize and interpret data. They predict, describe, compare, compute and draw conclusions based on what they observe and record.
Curated OER
Radioactive Decay Curve
Students gather and organize data. In this radioactive decay curve lesson, students gather data as they follow the provided procedures for rolling dice. Students chart their data and examine interval results.
Curated OER
Using Coordinate Geometry by Land, Sea and Outer Space.
Students complete a table of values and plot points, as well as construct a graph on a coordinate grid. They construct two graphs on the same coordinate system, and identify the point of intersection. Students represent and record...
Curated OER
Pumpkin Play
Have you ever examined a pumpkin and estimated the number of lines it has? In this math lesson plan, students count the actual number of lines, record and graph the results. They investigate the circumference, weight and buoyancy of the...
Curated OER
Grade 2: Spinning Sums
Second graders collect data by spinning two spinners and creating sums, organize the data, and make conclusions from the data. Each students makes a spinner. They spin and record the number of the section each time. Students work in...

