Virginia Department of Education
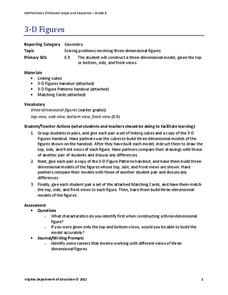
3-D Figures
Scholars construct three-dimensional figures to study dimension and side views. Learners build models using linking cubes to match views of different sides. After practicing with models, they attempt to match three-dimensional drawings...
Curated OER
Decreasing and Increasing Fractions
Use this math lesson to help your fourth graders further their understanding of ordering fractions. After completing some whole-group activities together as a class, pairs of students play an online game which has them compare fractional...
Curated OER
Range, Cluster, Gap and Outliers
There are a number of activities here where learners collect and record data, as well as, activities where the likelihood of an event happening is calculated given the experimental probability. Young statisticians organize information...
Curated OER
Balloon Bop: Skip Counting
Practice counting in patterns and skip counting by 1, 5, and 10. Once the patterns have been taught, teams of 5 or 6 learners -- holding hands in circles -- skip count each time they collectively bounce a balloon up into the air. Early...
Hawaiʻi State Department of Education
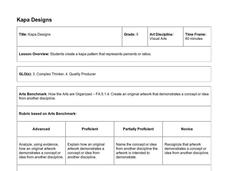
Kapa Designs
I always knew there was a connection between art and math, and this lesson proves it. Fifth graders will use what they know about ratios and percents to design art inspired by Polynesian kapa cloth. A grid, specific guidelines, and the...
Annenberg Foundation
Skeeters Are Overrunning the World
Skeeters are used to model linear and exponential population growth in a wonderfully organized lesson plan including teachers' and students' notes, an assignment, graphs, tables, and equations. Filled with constant deep-reaching...
Alabama Learning Exchange
Binomial Expansion—Shortcut Please
There has got to be a better way; you just have to find it! Given a general binomial to expand with increasing powers, pupils realize that there must be a better way than multiple multiplications. Classmates look for patterns and use...
Curated OER
Shape Collages
To reinforce shape recognition and identification, little learners create a shape collage. They name each shape as they go, gluing or pasting them onto bright paper. They discuss collage techniques and are encouraged to use their shapes...
Curated OER
Fair Shares and Geometric Spirals
Young scholars tackle the problem of how to divide a triangular piece of land fairly among four people. They decide whether their method of fair division always works or if it only works in special cases.
Curated OER
Exponential Expressions - Perfect Squares, Square Roots
Color tiles are used to model perfect squares. Alone or in pairs, middle schoolers will find patterns. Afterward, the relationship between perfect squares and roots will be discussed as a whole class.
Curated OER
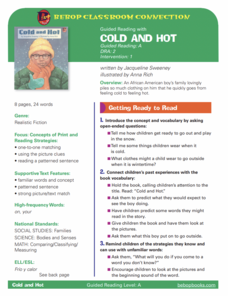
Guided Reading: Cold and Hot
Explore the text, Cold and Hot, with comprehension strategies for young readers. First, give them a purpose for reading: find out what the boy wore outside in the snow! Then have them use one-to-one matching and picture clues to...
Curated OER
Isolines on a Weather Map
Ninth graders recognize isolines on a weather map and draw isolines based on temperature data on a weather map. They draw isotherms on a weather map to identify temperature patterns.
Curated OER
Getting it Right! An Investigation of the Pythagorean Theorem
In order to learn about the Pythagorean Theorem, young mathematicians investigate relations and patterns between different sides of a right triangle to look for possible relations among the squared sides. Once they have established the...
Project Maths
Trigonometric Functions
From a circle to a cycle! The final lesson of a five-part series challenges learners to use points from the unit circle to plot a repeating pattern. The repeating patterns become the graphs of the trigonometric functions. Scholars...
Curated OER
Exploring Solving Equations
Put out by Texas Instruments, this lesson involves learners in an activity focused on adding polynomials, solving equations, factoring trinomials, and expanding binomials. A TI-89 calculator is needed to complete this lesson.
Curated OER
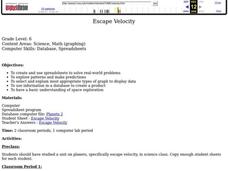
Escape Velocity
Sixth graders create/use spreadsheets to solve real-world problems, explore patterns, make predictions, select/explain most appropriate types of graph to display data, use information to create product, and have basic understanding of...
Curated OER
The Wonderful World of Escher
Bridging art and math can be as easy as making tessellations. The art, context, and life of M.C. Escher is explained to the class, as is the concept of tessellations. After a bit of art history, pupils get out the ruler, tape, and...
Curated OER
Patch Tool
Students use an Internet tool to explore shapes and how they combine. In this patterns lesson, students create quilting patterns using various shapes. Students recognize how the shapes fit together.
Improving Measurement and Geometry in Elementary Schools
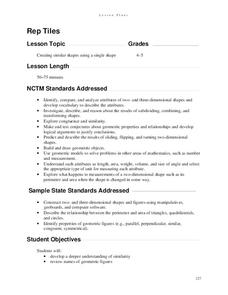
Rep Tiles
In addition to the catchy title, this lesson plan provides upper graders an opportunity to more closely scrutinize the attributes of plane figures. In particular, they focus on the similarity of different shapes. Both whole-class and...
Curated OER
Red Circle, Red Circle, What Do You See?
Young learners explore shapes and colors. They listen to Brown Bear, Brown Bear What Do You See? by Bill Martin Jr. and use the same language pattern to create a color and shape book of their own. After that, with the leftover magazine...
Curated OER
Reading Graphs
Working independently or in teams, your class practices connecting graphs, formulas and words. This lesson includes a guided discussion about distance vs. time graphs and looking at how velocity changes over time.
Curated OER
Another Way of Factoring
Focusing on this algebra instructional activity, learners relate quadratic equations in factored form to their solutions and their graph from a number of different aspects. In some problems, one starts with the original equation and...
Willow Tree
Approximating a Line of Best Fit
You may be able to see patterns visually, but mathematics quantifies them. Here learners find correlation in scatterplots and write equations to represent that relationship. They fit a line to the data, find two points on the line, and...
American Statistical Association
Scatter It! (Predict Billy’s Height)
How do doctors predict a child's future height? Scholars use one case study to determine the height of a child two years into the future. They graph the given data, determine the line of best fit, and use that to estimate the height in...
Other popular searches
- Growing Patterns in Math
- Number Patterns in Math
- Geometric Patterns in Math
- Pasta Patterns in Math
- Increasing Patterns in Math
- Patterns in Math Quiz
- Repeating Patterns in Math
- Color Patterns in Math
- Identifying Patterns in Math
- Nature's Patterns in Math
