Curated OER
Gold Rush California and its Diverse Population
Young scholars compare contemporary cultural differences with historical differences based on population percentage. For this cross-curriculum Gold Rush/math lesson, students analyze aspects of California's Gold Rush population and...
Curated OER
Stock Market Math
Students calculate commission for a stock transaction through a broker using the relationship between percentages and decimals. They decide which stocks are preferable based on the price to earnings ratios listed on the stock market quotes.
Curated OER
Coal Supply and Demand
A hands-on simulation perfect for an economics instructional activity, young learners investigate the availability of different sources of natural energy (coal, natural gas, oil, solar, and nuclear) and how this availability affects...
Curated OER
The Stock Market
Pupils explore the loss and gain made in the stock market as they invest a sum of money and report the results as percentages instead of points.
Curated OER
Explore Surface Types on a Journey Around Earth
Students explore satellite data. In this technology cross-curriculum math and world geography instructional activity, students locate specific map areas using a microset of satellite data. Students use technology and math skills to...
Yummy Math
US Holiday Candy Sales
Candy is a big business! Calculate the amount of money consumers spent on major holidays—Easter, Halloween, Christmas, Hanukkah, and Valentine's Day—based on the total amount of candy sales from 2011 and the percentage of each holiday's...
Radford University
Percentages: Lesson 1
Math can be taxing at times. With a short instructional activity, pupils determine how income tax affects take-home pay. Learners determine their net pay based on tax tables and how adjustments in their gross pay changes the paycheck.
Curated OER
The World in a Classroom
Students calculate percentages of different kinds of people in the world. For this diversity lesson plan, students will see the percentages of different people and different incomes based on if the world only had 100 people in it.
Curated OER
Determining the Existence of Gender Bias in Daily Tasks
Help your kids explore gender bias. Learners design and conduct a survey examining role responsibilities within families. They determine the percentage of responsibilities for males vs. females and graph the results. Then they analyze...
Curated OER
Who Represents You?
Students investigate Congress and how individuals are represented in this Country. In this government lesson, students complete worksheets research government web sites to determine which senators and congressmen represent them....
Museum of Tolerance
Why is This True?
Are wages based on race? On gender? Class members research wages for workers according to race and gender, create graphs and charts of their data, and compute differences by percentages. They then share their findings with adults and...
Curated OER
Integrating Gandhian Principles of Communal Unity in Mathematics
Fourth through sixth graders incorporate Gandhian principles into Math curriculum. They explore Gandhi's teachings on communal unity and economic equality. This has quite a bit of information about Gandhi and his observations and...
Curated OER
Fractions: Jewish Population of Europe during WWII
Students evaluate population maps and convert fractions to percentages. In this WWII lesson, students use statistics on the Holocaust to determine population loss and change. Students create their own math questions and answers using the...
Curated OER
Did Voters Turn Out -- or Are They Turned Off?
What was the voter turnout at your last state election? Examine voter turnout statistics from the most recent election to learn which ten states have the best turnout record. This lesson offers election data, handouts, and worksheets.
Education World
The African American Population in US History
How has the African American population changed over the years? Learners use charts, statistical data, and maps to see how populations in African American communities have changed since the 1860s. Activity modifications are included to...
Curated OER
Proportional Taxes
Students are able to define and give an example of a proportional tax and the impact that it can have on different income groups and explain how a proportional tax takes the same percentage from all tax groups.
Curated OER
Creating a Government
A simulation gives scholars a personal look at what goes into forming a government. Each of them is assigned 1 of 4 tribes which make up Borka, a hypothetical country. The tribe distribution is based on the percentage of people in each....
Curated OER
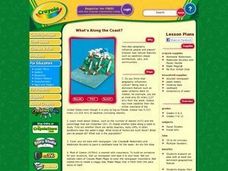
What's Along the Coast?
Students research an area with at least one dominant geographical feature. Then they display their findings in a realistic 3-dimensional presentation. Students also prepare ancillary material to support their project. Finally, they chart...
National Research Center for Career and Technical Education
Business Management and Administration: Compound Interest - A Millionaire's Best Friend
Many math concepts are covered through this resource: percentages, decimals, ratios, exponential functions, graphing, rounding, order of operations, estimation, and solving equations. Colorful worksheets and a link to a Google search for...
Global Oneness Project
Citizen Photojournalism
Matt Black's photo essay, "The Geography of Poverty" provides a shocking reminder of the poverty that exists in the United States. The resource not only focuses attention on poverty but also conditions that have given rise to situation...
Curated OER
The Demographics of Immigration: Using United States Census Data
Students work together to analyze United States Census data on immigration. They compare and contrast the data and determine how immigration numbers have changed over time. They calculate percentages and make their own conclusions...
Curated OER
Thinking About Technology: What Is It? How Can It Help Us?
What is technology and how can it help us? Using a worksheet, students read a list and choose practical applications of scientific knowledge, brainstorm examples of home, school and hospital technology, graph answers in a pie chart, and...
Curated OER
Having the Last Word
Students discuss the influence of foreign languages in their everyday speech after reading an article from The New York Times on language legislation in Brazil. Students are divided into 4 groups in order to research languages spoken...
Curated OER
Government Goods and Services
Fifth graders investigate the connection between taxes and government services. In this economics lesson, 5th graders discuss the process and benefits of paying sales and income taxes. Using calculators, students compute the...
Other popular searches
- Teaching Percentages
- Figuring Percentages
- Calculating Percentages
- Basic Money Percentages
- Math Percentages
- Markup Percentages
- Discount Percentages
- Decimals and Percentages
- Percentages and Math
- Math Lessons on Percentages
- Circle Percentages
- Percentages of Quantities


