Curated OER
Unit VII Energy: WS 1 Qualitative Analysis - Pie Charts
For each of eight diagrams of objects in motion, physics masters draw pie charts to depict the changes in energy. For each they must identify the energy conditions at each position. This is a unique worksheet, perfect for assessing how...
Beyond Benign
Municipal Waste Generation
Statistically, waste may become a problem in the future if people do not take action. Using their knowledge of statistics and data representation, pupils take a look at the idea of waste generation. The four-part unit has class members...
Howard Hughes Medical Institute
Patterns in the Distribution of Lactase Persistence
We all drink milk as babies, so why can't we all drink it as adults? Examine the trend in lactase production on the world-wide scale as science scholars analyze and interpret data. Groups create pie charts from the data, place them on a...
Curated OER
Solar Storm Energy and Pie Graphs
For this solar storm energy and pie graphs worksheet, students solve 5 problems using pie graphs that show the amount of solar energy that is converted into radiation, kinetic energy, flare energy and flare energy that is lost to working...
Curated OER
Discovering Mitosis in Onion Roots
Students discover the different stages of mitosis by examining onion roots under a microscope, drawing diagrams of what they see, and organizing collected data in a chart and create a pie graph from their lab data.
Curated OER
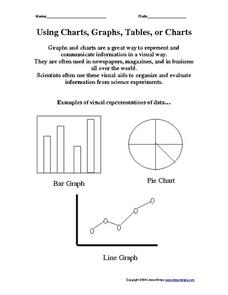
Using Charts, Graphs, Tables, or Charts
In this charts, graphs and tables worksheet, students view 3 different types of visual representations of data, make a list of 20 items and decide how the items can best be put together in groups to make a graph, chart or table. Students...
Curated OER
Deciding Which Type of Graph is Appropriate
For this graphing worksheet, learners read about line, bar, and pie graphs and then determine which graph is the best way to express data results. This worksheet has 3 short answer questions.
Curated OER
Graph a Panther's Diet
Students examine the diet of panthers. In this interpreting data lesson, students collect data on the panther's diet and chart the data in bar and pie graphs.
Curated OER
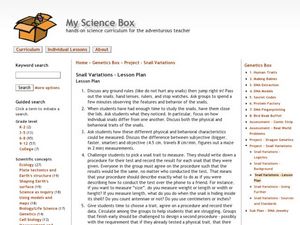
My Science Box
Students investigate snails and their physical and behavioral characteristics. In this investigative instructional activity students create a pie chart to show the results of their findings.
Curated OER
Science: Teddy Bear Nation
Students sort teddy bears according to types and then graph the results. They each bring a bear to class and then discuss their similarities and differences. Once the bears have been sorted into groups according to size and color,...
Curated OER
What's in a Graph?
How many yellow Skittles® come in a fun-size package? Use candy color data to construct a bar graph and a pie chart. Pupils analyze bar graphs of real-life data on the Texas and Massachusetts populations. As an assessment at the end of...
Curated OER
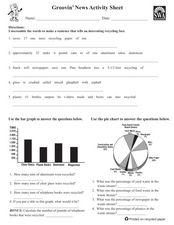
Groovin' News Activity Sheet
In these recycling worksheets, young scholars complete several activities to learn about recycling. Students complete a word search, word scramble, bar graph, pie chart, research project, class project, and individual project for recycling.
Columbus City Schools
What is Up Th-air? — Atmosphere
Air, air, everywhere, but what's in it, and what makes Earth's air so unique and special? Journey through the layers above us to uncover our atmosphere's composition and how it works to make life possible below. Pupils conduct research...
Beyond Benign
Water Bottle Unit
How much plastic do manufacturers use to create water bottles each year? The class explores the number of water bottles used throughout the years to determine how many consumers will use in the future. Class members compare different...
Virginia Department of Education
Igneous Rocks
High schoolers explore igneous rocks by observing rock samples and considering cooling rates and composition. The third installment of a five-part geology series culminates in an activity where learners use igneous rock characteristics...
Curated OER
Turning Tomato
Did you know that tomatoes are the world’s most popular fruit? Did you know that tomatoes are related to the deadly nightshade plant? Using red plates and brads, your researchers record tomato facts on a pie chart and create a Turning...
Beyond Benign
Plastic Bags
Paper or plastic? Explore the environmental effects of using plastic bags through mathematics. Learners manipulate worldwide data on plastic bag consumption to draw conclusions.
Curated OER
A Recipe for Air
Young scholars create a pie graph using M&Ms to demonstrate the composition of air. They label each section of the graph, and list the fractions from largest to smallest.
Curated OER
Recycling Statistics
In this environment worksheet, students look for the answers to the environmental impact of recycling in Great Britain with the statistics from the pie graph.
Curated OER
What's Air Got to Do with It?
Learners use M&M's to create a pie graph that expresses their understanding of the composition of air. They watch and conduct several simple experiments to develop an understanding of the properties of air (it has mass, it takes up...
Curated OER
The Composition of the Atmosphere
In this atmosphere learning exercise, students identify the major components of the earth's atmosphere and write the percentage of each. They also fill in a pie graph of the percent composition of the atmosphere and answer questions...
Curated OER
Trash a Pizza!
Young scholars investigate data about America's trash production. In this environmental lesson, students use statistics about what we throw away to create an art pie chart project called a "trash pizza."
Curated OER
Instructions for Assembly of 'Opae" ula life-cycle wheel
Students study Opae ula. In this life cycle, art lesson, students color and cut out the printout of the life cycle of the Opae ula (red shrimp of Hawaii). They work independently to create the pie chart representing this life cycle. This...
Curated OER
What's in Soil?
Students examine soil samples and make observations. In this soil lesson plan, students participate in experiments to determine the components (mineral matter, organic matter, water air) in the soil. Students analyze a pie graph on the...
Other popular searches
- Pie Charts and Graphs
- Interpreting Pie Charts
- Fraction Circles Pie Chart
- Circle Graphs Pie Charts
- Energy Pie Chart
- Reading a Pie Graph
- Creating a Pie Chart
- Bar Graphs, Pie Charts
- Pizza Pie Graph
- Nutrition Facts Pie Graph
- Pie Chart Activity
- M&m Pie Chart


