Curated OER
Analyzing Literary Devices
Eighth graders identify figurative language and poetry in this literary analysis lesson. Using Through the Looking Glass by Lewis Carroll and a YouTube video for "The Walrus and the Carpenter," young readers complete a literary device...
Curated OER
The Joy Luck Club: Bloom's Taxonomy: Questions
Really challenge your class when they're reading Amy Tan's The Joy Luck Club. Provide them with this list of six thought-provoking questions to encourage a deeper analysis. The questions are based off of Bloom's Taxonomy, and a list of...
Michigan State University
Bug Lyphe!
Introduce ecology classes to biodiversity and interdependence in ecosystems with a PowerPoint presentation. Then, they get up-close and personal with the invertebrate world by collecting insects, classifying them, and graphing their...
Space Awareness
Britannia Rule the Waves
Could you determine longitude based on measuring time? Early explorers used a longitude clock to do just that. Scholars learn about early exploration and the importance of the invention of the clock. Then pupils build their own longitude...
Purdue University
The Represented World: Recreational STEM
How are forces and motion important to a swing set? Scholars explore the concepts of force and motion using swing sets. In preparation for their own STEM design project, individuals take surveys and data from peers, complete labs on...
Curated OER
Random Probability
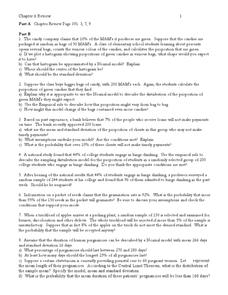
In this statistics and probability worksheet, young statisticians solve and complete 13 different problems related to probability, percentages, and normal distributions. They consider data models, assumptions about the models, and find...
Curated OER
Polynomials
In this worksheet, students solve and complete 32 various types of problems. Included are problems on simplifying polynomials, factoring, graphing equations by plotting points, and simplifying expressions using the rules of...
Curated OER
Walk-A-Thon
Students graph linear http://www.lessonplanet.com/review?id=180542equations. For this problem solving lesson, students calculate slope and plot ordered pairs on a coordinate grid. Using a real-life example of a walk-a-thon, students...
Curated OER
The Coastal Ocean: Estuaries and Continental Shelves
Amazing high-quality satellite imagery, photos, informational graphs, and detailed diagrams comprise this presentation on the movement of estuaries and the continental shelf. Data used as an example is from The Chesapeake Bay and because...
Shmoop
ELA.CCSS.ELA-Literacy.RL.9-10.9
As the saying goes: there are no new stories. Standard 9 for reading literature in the Common Core addresses this fact and requires that students be able to analyze how authors use the themes, stories, and characters of earlier works....
Mathematics Assessment Project
Maximizing Area: Gold Rush
Presenting ... the gold standard for a instructional activity. Learners first investigate a task maximizing the area of a plot for gold prospecting. They then examine a set of sample student responses to evaluate their strengths and...
Balanced Assessment
A Loud Noise
In a scale measuring noise, an increase in 10 dB is a 10 time increase in power. Mathematicians examine the data graph of a real world exponential growth, with no logarithmic scale, and then create two equations relating the decibels and...
NFL
Super Bowl: History and Anthology
The educational opportunities are overwhelming with this (almost) complete anthology and history of every Super Bowl since 1968. Excite your football enthusiasts with information that can be used to create cross-curricular activities in...
Science Matters
Ring of Fire
Over a period of 35 years, earthquakes and volcanoes combined only accounted for 1.5 percent of the deaths from natural disasters in the United States. The 15th lesson in a 20-part series connects the locations of earthquakes and...
Serendip
Soap Opera Genetics – Genetics to Resolve Family Arguments
Did she cheat on her husband? Did the hospital switch the babies? Should they have children? As much as this sounds like the plot for a soap opera, all of these questions fit into a single lesson on genetics. Scholars read about three...
Curated OER
Tech Algebra: A Statistics Study
Students use the internet to gather a minimum of thirty pieces of data. Students create box and whisker graphs, and stem and leaf plots from the information. They calculate mean, median, mode, and range. Students write a summary and...
Curated OER
Measuring Mania
Learners rotate through stations in the classroom, completing different types of measurements. These measurements are placed into a spreadsheet, and a scatter plot is generated. They type an explanation of their results in correlation...
Curated OER
Record 'The' Results
Third graders predict how many times they'll see the word "the" in a newspaper page and highlight all the "the"s they find. After reviewing definitions of range, median, mode, mean they create a Stem and Leaf Plot and a Back-to-Back Stem...
Curated OER
Statistical Accuracy and Reliability
Ninth graders assess the accuracy and reliability of current survey data and how it is represented. They design a survey, collect data, and use technology to analyze the data and present the results. Students examine scatter plots and...
Curated OER
M&M Exponential Activity
Students create a scatter plot of their experimental data. In this algebra lesson, students use M&M's to determine an algebraic model. They discuss results in class.
Curated OER
Drops on a Penny
Eighth graders experiment to determine the number of drops of water a heads up penny hold. They create a stem and leaf graph of the class results and use the data for further experimentation on a tails up penny.
Curated OER
The Bigger they Are . . .
Students do a variety of data analyses of real-life basketball statistics from the NBA. They chart and graph rebounding, scoring, shot blocking and steals data which are gathered from the newspaper sports section.
Curated OER
Reaching New Heights
Learners explore the relationship between two variables. Students measure their arm span and height. They gather this class data to design a scatter plot. Learners interpret the meaning of individual coordinates and the overall graph....
Curated OER
Best Guesser
Fifth graders develop strategies for estimating ages, and illustrate results by graphing and interpreting scatter plots to compare x and y coordinates.


