Curated OER
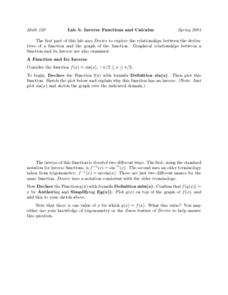
Lab 5: Inverse Functions and Calculus
Learners identify graphical relationships between a function and its inverse using a graphing calculator. They begin by declaring the function f(x) with formula definition sin(x), then plot this function. To finishing the lab, they check...
CK-12 Foundation
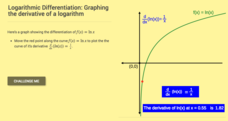
Logarithmic Differentiation: Graphing the Derivative of a Logarithm
Log the values of the derivative of a logarithm. The interactive plots the derivative of the natural logarithm. Learners first determine the derivative of natural logarithm and the general logarithm. Using the formulas for the...
EngageNY
Arithmetic and Geometric Sequences
Arithmetic and geometric sequences are linear and geometric patterns. Help pupils understand the relationship and see the connection with an activity that asks them to write the rules and classify the patterns correctly. A sorting...
Curated OER
Relating Algebra to Geometry
Learners investigate the connection that exists between Algebra and Geometry. They classify two and three-dimensional figures. Pupils use formulas to solve problems in geometry and use appropriate measuring devices in the right contexts.
Curated OER
Investigation-Looking at Polygons
Eighth graders plot points and investigate polygons. They locate a point, using ordered pairs of integers on the coordinate plane. Students compare geometric measurements and computations on coordinate axes as they are applied to...
Curated OER
Secant and Tangent Lines
Twelfth graders recognize the use of the slope of the secant line and connect it with the graph of the secant line, as the secant line approaches the tangent line. They also recognize the two forms of the slope formula used and practice...
Alcohol Education Trust
Talk About Alcohol: How Much Alcohol is in a Drink?
Introduce your class to alcohol content. In order to become aware of the varying strengths of alcoholic drinks, class members complete a chart and plot a bar chart with the results. They make observations about the results.
Curated OER
Worksheet 25
In this math worksheet, students draw a graph of functions on a polar graphing system. They graph two functions by first plotting them on the vertical axis as a function of a given angle, then by plotting them at a radial distance from...
Curated OER
Annual Wetland Plant Diversity Survey
Learners locate an area of marsh and, by measuring the total number of individual plants in a sample area, determine whether purple loosestrife population density is correlated to the total plant diversity of the community. They...
Curated OER
Write an Equation of a Line Given Slope and a Point
Ninth graders are investigating slope of a line. The line is plotted using the slope and points on a line. They also write an equation given the right information. The use of a PowerPoint is part of the presentation.
Curated OER
Properties of Logarithms
Students explore the concept of logarithms. In this logarithms instructional activity, students graph logarithms on their Ti-Nspire calculator. Students describe the shapes of their graphs by identifying slope, y-intercepts, and...
Curated OER
Integrated Algebra
In this integrated algebra worksheet, students solve problems covering topics studied during the year. Problems include topics such as slope-intercept, Venn Diagrams, finding the solution to multi-step algebra problems, writing...
Vanier College
Analyzing Short Stories/Novels
Good questions can help focus readers' attention on the elements writers use to add depth to their stories. The questions on this worksheet do just that and encourage readers to think critically about a story and author's purpose.
Los Angeles County Office of Education
Assessment For The California Mathematics Standards Grade 6
Test your scholars' knowledge of a multitude of concepts with an assessment aligned to the California math standards. Using the exam, class members show what they know about the four operations, positive and negative numbers, statistics...
PBL Pathways
Doctors and Nurses
How many nurses does it take to support one doctor? A project-based activity asks learners to analyze state data to answer this question. Classes create polynomial functions from the data of doctors and nurses over a seven-year period....
Curated OER
Mathematical Modeling
Study various types of mathematical models in this math lesson. Learners calculate the slope to determine the risk in a situation described. They respond to a number of questions and analyze their statistical data. Then, they determine...
Mathematics Assessment Project
College and Career Readiness Mathematics Test C1
Challenge high schoolers with a thorough math resource. The 20-page test incorporates questions from upper-level high school math in applied and higher order questions.
Teach Engineering
Understanding the Air through Data Analysis
Is there a correlation or causation relationship between air pollutants? Groups develop a hypothesis about the daily variation of air pollutants, specifically ozone and CO2. Using Excel to analyze the data, the groups evaluate their...
Teach Engineering
Graphing Equations on the Cartesian Plane: Slope
Slopes are not just for skiing. Instructors introduce class members to the concept of slope and teach them how to calculate the slope from a graph or from points. The lesson also includes the discussion of slopes of parallel and...
Radford University
A Change in the Weather
Explore the power of mathematics through this two-week statistics unit. Pupils learn about several climate-related issues and complete surveys that communicate their perceptions. They graph both univariate and bivariate data and use...
Beyond Benign
Got Gas
How much gas does it take to drive around town? The class uses a variety of mathematical procedures to take a look at the use of gas for transportation. Class members use a different unit to determine the cost of driving a car as opposed...
Inside Mathematics
Coffee
There are many ways to correlate coffee to life, but in this case a worksheet looks at the price of two different sizes of coffee. It requires interpreting a graph with two unknown variables, in this case the price, and solving for those...
Curated OER
Eagle Creek Park (A Hike)
Students plot a hiking course using aerial photos and a topographic overlay and find the latitude and longitude of absolute locations. They measure the total distance of a hiked area and figure the area of the ground walked using Heron's...
Curated OER
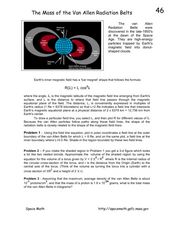
The Mass of the Van Allen Radiation Belts
In this van Allen Radiation Belts learning exercise, students are given the formula for the field line of the Earth's inner magnetic field. Students use this equation to find the polar coordinates of a field line in the van Allen Belts....


