Wordpress
Equation Table Graph
Your Algebra learners will appreciate this fabulous, two-page printable. The first page has a list of numbers that lead to the learners writing an equation in a cloud that represents these numbers, and then filling in a table, and...
EngageNY
The Graph of a Linear Equation in Two Variables
Add more points on the graph ... and it still remains a line! The 13th installment in a series of 33 leads the class to the understanding that the graph of linear equation is a line. Pupils find several solutions to a two-variable linear...
Education Development Center
Geography of the Coordinate Plane
Put the graph into graphing and allow learners to understand the concept of point plotting and how it relates to data. The worksheet provides a nice way to connect data analysis to a graph and make predictions. The worksheets within the...
Curated OER
Graphing Lines by Graphing Two Points
Use a graphing lines worksheet to have your mathematicians graph the line of a given equation and plot specified points. The first 10 problems have a given equation, and two values. The next 10 problems have a given equation, but your...
Curated OER
Graphs
For this algebra worksheet, students solve three linear equations to by substitution to determine if the given point is a solution. Students graph and determine the slope and y-intercept of 5 linear equations.
Curated OER
Graphs and Functions
Middle schoolers describe plotting functions on the Cartesian coordinate plane. They solve functions on paper and using an online tool to plot points on a Cartesian coordinate plane creating lines and parabolas.
Saxon
Plotting Functions
Youngsters use a graphing calculator to assist in creating a function table. They graph the function on a coordinate plane. They explore the relationship between the domain and range in the graph. This four-page worksheet contains two...
Curated OER
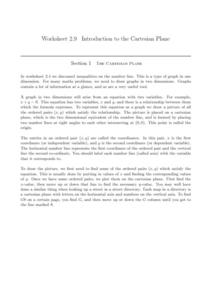
The Cartesian Plane
Learners solve and complete 22 various types of problems. First, they find the gradients of the lines and plot the given points. Then, they complete the table of values for each equation and use the table to draw the graph.
Curated OER
Reading Graphs
Working independently or in teams, your class practices connecting graphs, formulas and words. This lesson plan includes a guided discussion about distance vs. time graphs and looking at how velocity changes over time.
Curated OER
When Will We Ever Use This? Predicting Using Graphs
Here are a set of graphing lessons that have a real-world business focus. Math skills include creating a scatter plot or line graph, fitting a line to a scatter plot, and making predictions. These lessons are aimed at an algebra 1 level...
Shodor Education Foundation
Scatter Plot
What is the relationship between two variables? Groups work together to gather data on arm spans and height. Using the interactive, learners plot the bivariate data, labeling the axes and the graph. The resource allows scholars to create...
Curated OER
Interpret Graphs of Ordered Pairs
Middle and high schoolers solve four word problems based on three different graphs of ordered pairs which show the amount of money spent on lunch on particular days. Next, learners are given two equations of functions, and an x value and...
Curated OER
Graphs: Linear Functions
In this linear function worksheet, students use tables to find the values of functions. They graph linear functions and explore the significance of the coordinates. This two-page worksheet contains 4 multi-step problems. Graph paper is...
Curated OER
Graphing Linear Equations
In this graphing linear equations worksheet, students plot 22 lines on their coordinate grids. When directions are followed carefully, the result is a picture.
Teach Engineering
Coordinates and the Cartesian Plane
The plot thickens to get a functional understanding. After a short review of plotting points on the coordinate plane, class members learn the difference between functions and relations in the second lesson in a series of nine. They show...
Teach Engineering
Graphing Equations on the Cartesian Plane: Slope
Slopes are not just for skiing. Instructors introduce class members to the concept of slope and teach them how to calculate the slope from a graph or from points. The lesson also includes the discussion of slopes of parallel and...
Virginia Department of Education
Graphing Linear Equations
Combine linear equations and a little creativity to produce a work of art. Math scholars create a design as they graph a list of linear equations. Their project results in a stained glass window pattern that they color.
EngageNY
Graphs of Simple Nonlinear Functions
Time to move on to nonlinear functions. Scholars create input/output tables and use these to graph simple nonlinear functions. They calculate rates of change to distinguish between linear and nonlinear functions.
Curated OER
Graphing From Function Tables
In this graphing from function tables worksheet, students graph given functions from a completed function table. This is a worksheet generator, the teacher can set the grid size for plotting points as well as whether or not to include a...
Curated OER
Twenty-Seven Graphing Lines, Parabolas, and Absolute Value Problems
Have learners find coordinates of point on a graph, find equations of graphs given, and graph given equations using in and out tables. There are 27 problems related to equations for lines, parabolas, and absolute value functions.
Curated OER
Coordinate Graphs, Translations and Reflections
Students perform translations and reflections. In this algebra lesson, students use the TI calculator to graph functions. They move the functions around on the coordinate plane using translation and reflection.
Curated OER
Coordinates
In this coordinates instructional activity, students analyze two maps and identify the coordinates of ten specific locations. Students plot sixteen points on a graph and check their answers online at the end of each exercise.
Curated OER
Play Battleship on Graph Paper
Who says learning can't be enjoyable? Your class will love identifying the x axis and y axis of a coordinate plane and plotting various points when it's dressed up in the guise of a Battleship game. Rather than sets of the actual game,...
Curated OER
Identify and Graph Linear Equations
Students investigate linear functions. In this mathematics lesson plan, students plot points onto a graph by solving the equations y=x and y=mx+b by being given numbers for x and solving for y.


