Shodor Education Foundation
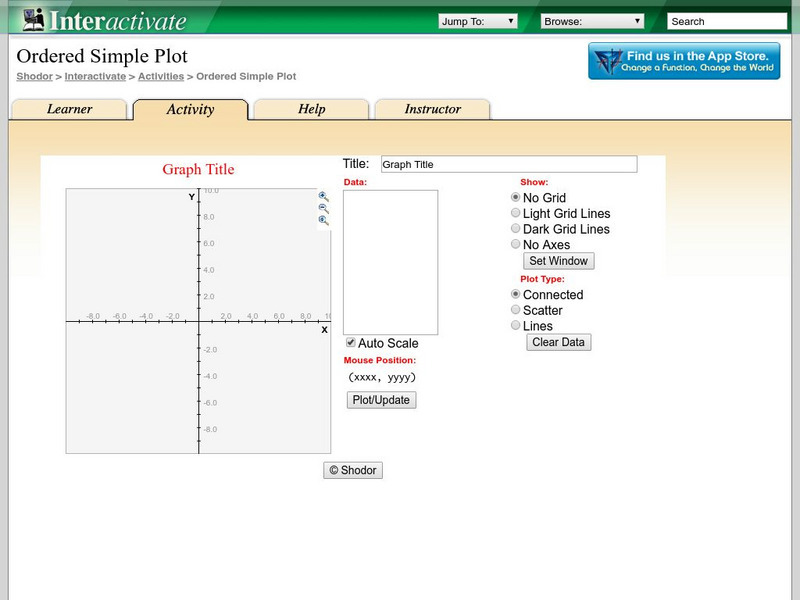
Shodor Interactivate: Ordered Simple Plot
The interactive learning activity allows students to plot multiple ordered pairs. Teacher resources are included.
Shodor Education Foundation
Shodor Interactivate: Interactive: Scatter Plot
Use this interactive applet to input a series of (x, y) ordered pairs and plot them. Parameters such as minimum and maximum value, minimum and maximum y value, and x- and y-scale can be set by the user or determined by the applet.
Shodor Education Foundation
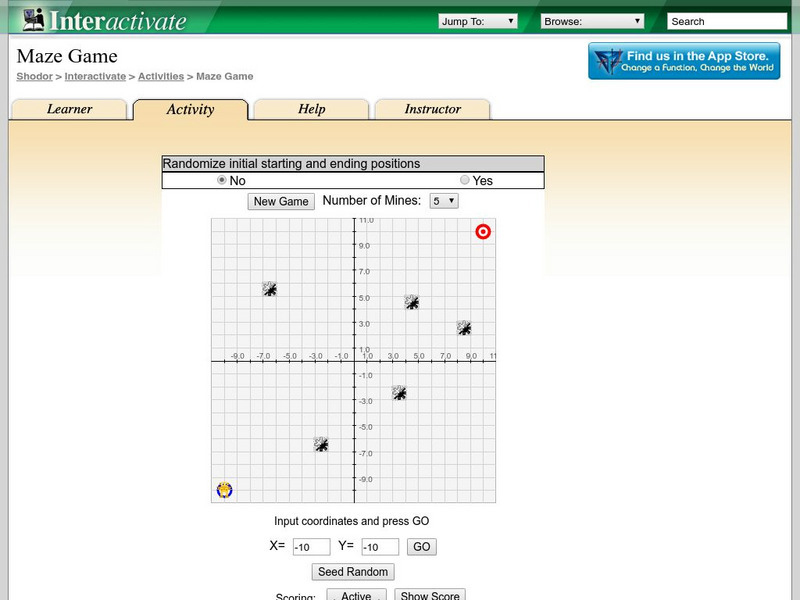
Shodor Interactivate: Maze Game
The interactive learning game has students practice their point plotting skills as they move through a mine field. The goal of the game is to get to a target location without crossing a mine.
Shodor Education Foundation
Shodor Interactivate: Simple Coordinates Game
This applet allows students to practice plotting points and identifying ordered pairs on a coordinate plane. The learning resource consists of the activity, instructions, instructor notes, and additional resources.
Shodor Education Foundation
Shodor Interactivate: General Coordinates Game
This applet allows students to practice plotting points and identifying ordered pairs on a coordinate plane. The learning resource consists of the activity, instructions, instructor notes, and additional resources.
Better Lesson
Better Lesson: Plotting Climate Data
Third graders use climate data to create a key, plot data points, and interpolate data.
Shodor Education Foundation
Shodor Interactivate: Scatter Plot
Graph ordered pairs and customize the graph title and axis labels. Points are connected from left to right, rather than being connected in the order they are entered.
Khan Academy
Khan Academy: Rotate Points
Given a point and a definition of a rotation, plot the rotation on a coordinate plane or identify the coordinates of the rotated point.
Shodor Education Foundation
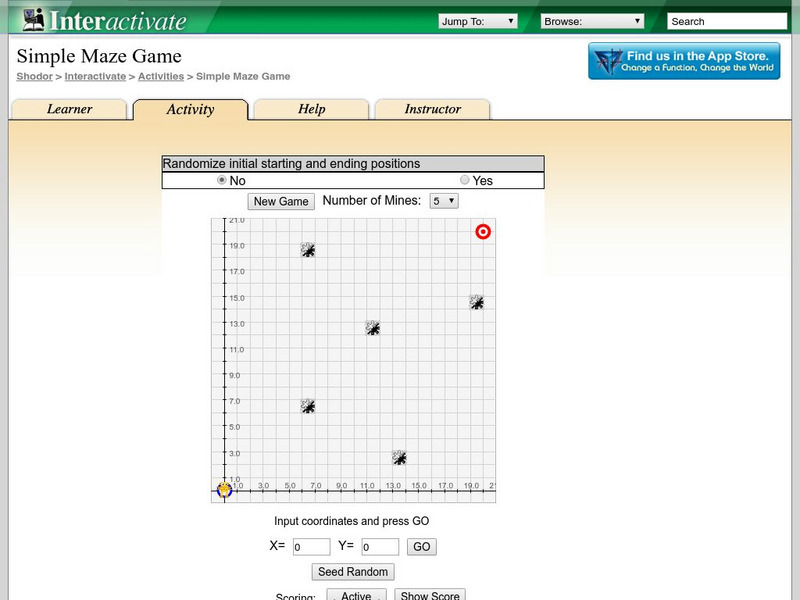
Shodor Interactivate: Simple Maze Game
This applet allows students to practice plotting ordered pairs on a coordinate plane. The learning resource consists of the activity, instructions, instructor notes, and additional resources.
National Endowment for the Humanities
Neh: Edsit Ement: Lesson 5: Faulkner's the Sound and the Fury: April Eighth, 1928
In this lesson plan, students will consider Lesson 5: Faulkner's The Sound and the Fury: April Eighth, 1928: Narrating from an 'Ordered Place'?. Worksheets and other supporting materials can be found under the Resources tab.
Duke University
Duke University: Web Feats Ii: Lessons on Regression at Hessian
This site has several lessons on regression, "Designed to help students visualize topics associated with lines of regression, given a set of data points." Go to the teacher notes to find the objectives and standards which apply.
Shodor Education Foundation
Shodor Interactivate: Simple Coordinates Game
Investigate the first quadrant of the Cartesian coordinate system through identifying the coordinates of randomly generated points, or requesting that a particular point be plotted.
Shodor Education Foundation
Shodor Interactivate: General Coordinates Game
Investigate the Cartesian coordinate system through identifying the coordinates of a randomly generated point, or requesting that a particular point be plotted.
Illustrative Mathematics
Illustrative Mathematics: 2.md the Longest Walk
In this lesson plan students will measure different points on the map and create a line plot from those measurements.
Yale University
Yale University: Elements of the Short Story
This unit from the Yale University on elements of the short story is designed to develop student comprehension skills, particularly making inferences and generalizing. It also involves students in reading a number of short stories to...
Help Algebra
Help algebra.com: Rectangular Coordinates
The parts of the coordinate plane are described and plotting ordered pairs is demonstrated with several examples. The four quadrants of the coordinate plane are also defined.
Purple Math
Purplemath: Scatterplots and Regressions
Explains the purpose of scatterplots, and demonstrates how to draw them.
Oswego City School District
Regents Exam Prep Center: Regression Analysis
A collection of lesson ideas, a practice activity, and teacher resources for exploring regression analysis.
Khan Academy
Khan Academy: Histograms Review
A histogram displays numerical data by grouping data into "bins" of equal width. Each bin is plotted as a bar whose height corresponds to how many data points are in that bin.
Other popular searches
- Plotting Coordinates Picture
- Plotting Points Pictures
- Fun Plotting Points
- Plotting Points on Graphs
- Plotting Coordinates Maps
- Plotting Coordinates on Maps
- Plotting Points on a Graph
- Plotting Coordinates Graphs
- Plotting Points on a Grid
- Plotting Points Math
- Ell Math Plotting Points


