Curated OER
Fishing for Points
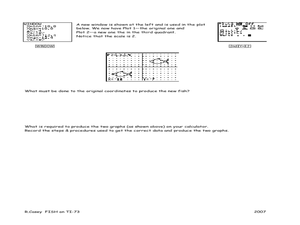
Learners explore the concept of ordered pairs. In this ordered pairs instructional activity, pupils list the ordered pairs of a graph in the shape of a fish. They use their calculator to translate the fish using lists, then translate the...
CCSS Math Activities
Smarter Balanced Sample Items: 6th Grade Math – Claim 4
Develop a model for prep. The resource provides examples of how items reflect modeling and data analysis for Smarter Balanced assessments. Items use on-grade or below-grade content to focus on the modeling aspect. The questions revolve...
PBL Pathways
College Costs
Predict the year that college costs will double in your state using linear modeling. The first part of this two-part project based learning activity asks young mathematicians to use data from the College Board. They graph the data,...
Curated OER
Rational Functions
Through a mini assessment, high schoolers identify and list the vertical and horizontal asymptotes for the given rational functions and determine the type of asymptote of a given rational function. They also decide which form of a...
EngageNY
Choosing a Model
There's a function for that! Scholars examine real-world situations to determine which type of function would best model the data in the 23rd installment of a 35-part module. It involves considering the nature of the data in addition to...
GeoGebra
Too Big, or Not Too Big
Determine whether the point is just right. The interactive allows participants to input a constraint equation. Pupils pick a point and determine whether it is too big, not too big, or just right for the constraint. Using the graphing...
Curated OER
Functions and the Vertical Line Test
Students examine functions and function notation. They use computer activities to discover how to graph functions, and conduct a vertical line test. Students describe spatial relationships using coordinate geometry.
Curated OER
Polynomials
In this worksheet, students solve and complete 32 various types of problems. Included are problems on simplifying polynomials, factoring, graphing equations by plotting points, and simplifying expressions using the rules of...
Curated OER
Line Graphs
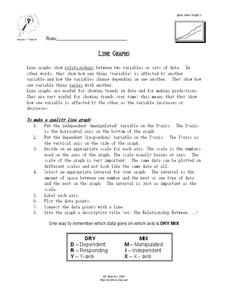
In this algebra worksheet, learners describe the relationship between a line graph and its data. They define the reasons line graphs are used and discuss increasing and decreasing lines. There is one involved questions, requiring several...
CK-12 Foundation
Determining the Equation of a Line: Temperature Conversion Challenge
Line up the temperature conversions. Pupils create the linear function between Celsius and Fahrenheit on a graph by plotting the freezing and boiling points of water. The scholars determine how the relationship changes based upon...
Curated OER
The Apple Orchard Problem
Students explore various approaches to solving a problem of maximizing the total production of apples in an orchard. In this apple orchard lesson, students collect data in order to solve the apple orchard problem presented. Students plot...
Curated OER
Absolute Zero Lab
In this absolute zero learning exercise, students experiment with a closed-end syringe and a ice bath and boiling water. They record volumes of gases in the syringe as well as temperatures of the water and they plot their experimental...
Curated OER
Differentiating Special Functions
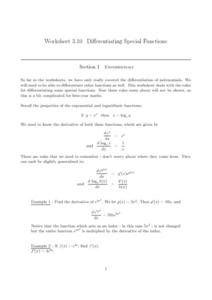
In this differentiating special functions worksheet, students solve and complete 5 various types of problems. First, they differentiate each of the given functions. Then, students complete the table using a calculator and plot the points...
Institute of Electrical and Electronics Engineers
Get Connected with Ohm's Law
Ideal for your electricity unit, especially with middle schoolers, this lesson plan gets engineers using multimeters in electrical circuits to explore the relationships among voltage, current, and resistance. Older learners may even plot...
Curated OER
The Workers
Students observe the axis of a graph on the board and add the title and axis labels. They plot two points on the graph and join the two with a line and work to describe the story in each of the graphs.
Curated OER
Plotting with Pennies
Fifth graders use pennies to gather data, organize and order data, graph the data on a stem-and-leaf plot, and evaluate the range, median, and mode of the data.
Curated OER
Coordinate Graphs, Translations and Reflections
Students perform translations and reflections. In this algebra lesson, students use the TI calculator to graph functions. They move the functions around on the coordinate plane using translation and reflection.
Curated OER
My Peanut Butter is Better Than Yours!
Learners explore the concept of statistical data. In this statistical data lesson, students read an article about the dangers of peanut butter to those who are allergic. Learners perform a taste test of two different brands of peanut...
Curated OER
Graphing Coordinates
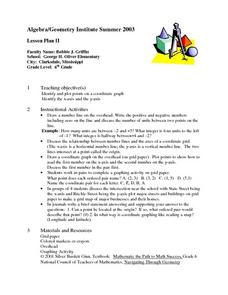
Sixth graders practice graphing coordinates. In this geometry lesson, they use the x and y axis to locate points that must be connected in the right sequence to form a straight line.
Curated OER
Plotting Grids Using Battleship
Learners coordinate grid points on X and Y axises to plot a physical location. The game of "Battleship is used to present first hand knowledge of this skill.
Curated OER
A Christmas Project
Seventh graders publish a letter and spreadsheet using the computer. They build a three-dimesnsional object with construction paper and develop a Christmas object using coordinates on a graph. Students compose a response in their journals.
Curated OER
Students Analyze Data With Scatter Plots
Scatter plot lessons can help students create different types of graphs by hand or with the aid of technology.
Curated OER
Coordinate Plotting: Shapes
In this math worksheet, students graph ordered pairs on a coordinate grid. They connect the points to create a geometric shape. This worksheet generator allows teachers to select the size of the grid, the complexity of the shapes, and if...
Curated OER
Give Me A Break!
Students create and conduct a survey. In this broken bones lesson, students discuss if they've ever broken a bone and how a broken bone heals. Students generate questions for a survey on broken bones and healing time, conduct the survey...
