Curated OER
Geometry Coordinates
In this geometry coordinates worksheet, students plot given ordered pairs. This one-page worksheet contains 6 problems.
Curated OER
Finding the Basal Area of a Forest Plot to Determine Stocking Levels
Learners use graphs and plots to measure the basal area and stocking levels. In this graphing instructional activity students work in the field the use their data to help them complete a lab activity.
Curated OER
Coordinate Graphs
Students use coordinate graphs in order to identify objects and their locations. They are shown how to plot the x and y coordinates and then are given values to be plotted during guided and independent practice. Students are assessed on...
Curated OER
Graphing Integers
Fifth graders complete an integer graphing activity. For this integer graphing lesson, 5th graders use coordinate grids to help them complete linear functions and integer graphing.
Curated OER
Graphing Parabolas and Circles
Students graph parabolas and circles. In this algebra lesson, students create a table of values and graph the coordinate pairs to create a graph. They graph a circle using the radius and center.
Curated OER
Investigating Linear Equations Using Graphing Calculator
Students investigate linear equations using the Ti-Calculator. For this algebra lesson, students graph lines and identify the different quadrants on a coordinate plane. They identify ordered pairs used to plot lines.
Curated OER
Scatter Graphs
In this scatter graphs worksheet, students learn a way of illustrating information about two related values. Students complete 30 questions about the graphs. Note: One of the graphs has English pounds. This is intended as an online...
Curated OER
Solving Quadratic Equations by Graphing
Students solve quadratic equation by graphing. In this algebra lesson, students use the TI calculator to get a visual of their graph. They create a table of values, plot their points and graph the parabola.
Curated OER
Algebra/Geometry Institute Summer 2007: Graphing Activity
Seventh graders practice identifying coordinates by examining a city map. For this graphing lesson, 7th graders create coordinate directions on an index card and practice locating these locations on a grid. Students read and...
Curated OER
Graphing on a Coordinate Grid
Learners work in groups to create a graph on a coordinate grid. In this graphing lesson plan, students analyze data and put it into their graph by plotting points.
Curated OER
The Coordinate Plane
Use this Saxon math coordinate plane instructional activity to have your learners utilize a graphing calculator, equate the vertices of a rectangle, and then graph their conclusions as well as answer a variety of fill in the blank...
Curated OER
How Many Frogs?
Students explore the concept of linear regression. In this linear regression lesson, students find the line of best fit for a set of data pertaining to a frog population. Students use their line of best fit to predict the frog population...
Curated OER
Geometry: Translations and Reflections
Group work and participation is used to perform a specified translation or reflection. For this geometrical translation lesson, small groups of pupils are each given a shape to plot on a coordinate grid. Each shape is then translated or...
Curated OER
Graphing Ordered Pairs
In this math worksheet, students learn to graph ordered pairs. Students examine a graph with 3 labeled points and tell the ordered pairs for each. Students also plot 8 ordered pairs on a graph they draw themselves.
Illustrative Mathematics
Introduction to Linear Functions
Introduce your algebra learners to linear and quadratic functions. Learners compare the differences and relate them back to the equations and graphs. Lead your class to discussions on the properties of a function or a constant slope...
Curated OER
Inquiry Unit: Modeling Maximums and Minimums
Young mathematicians explore the maximun area for patio with the added complexity of finding the mimimum cost for construction. First, they maximize the area of a yard given a limited amount of fence and plot width v. area on a...
Curated OER
Explorations 5: Introduction to Limits
In this limit worksheet, students find the interval values of given functions. They identify constants, and plot graphs. This three-page worksheet contains approximately 20 problems.
EngageNY
End-of-Module Assessment Task - Algebra 2 (Module 1)
A series of assessment tasks require learners to process information and communicate solutions. Topics include graphing parabolas, solving linear-quadratic systems, factoring polynomials, and solving polynomial equations.
EngageNY
Mid-Module Assessment Task - Algebra 1 (module 2)
A mid-module assessment uses two multi-part questions to measure progress toward mastery on descriptive statistics standards. Each part of a question addresses a single standard to help determine mastery.
Curated OER
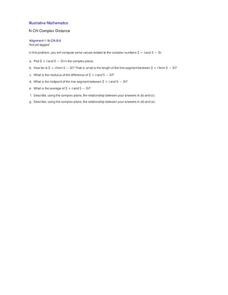
Complex Distance
Have learners graph complex numbers to gain a visual and mathematical understanding of the distance and the midpoint between two complex numbers. This lesson is short, but to the point, and addresses an important complex number...
EngageNY
Arithmetic and Geometric Sequences
Arithmetic and geometric sequences are linear and geometric patterns. Help pupils understand the relationship and see the connection with an activity that asks them to write the rules and classify the patterns correctly. A sorting...
Curated OER
Worksheet 25
In this math worksheet, students draw a graph of functions on a polar graphing system. They graph two functions by first plotting them on the vertical axis as a function of a given angle, then by plotting them at a radial distance from...
Curated OER
Lines, Lines, Everywhere
Pupils explore linear equation suing real life scenarios. In this algebra lesson, students find the slope and intercept of a line. They create table of values to plot their graph and draw conclusions.
Curated OER
Word Problems
Students solve word problems using mathematical symbols. In this algebra lesson, students collect data and analyze it. They analyze the data using a table or graph after plotting the data.


