Curated OER
Supersonic Dream
Students explore how fuel use affects the mass of different planes during flight and graph their results. They determine the per person fuel cost of a transatlantic flight for seven airplanes
Curated OER
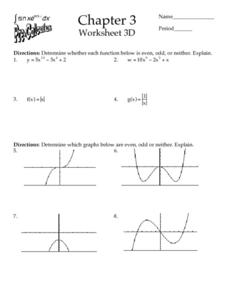
Chapter 3 - Worksheet 3D
In this pre-calculus worksheet 3D, students determine if a function is even or odd. They sketch graphs of functions and find the inverse of functions. This two-page worksheet contains 18 problems.
Curated OER
Comparing Costs
Learners compare the costs of two cellular phone plans and determine the best rate. They use a table and a graph of points plotted on a Cartesian plane to display their findings. Students write an equation containing variables that could...
Curated OER
Shake It Up with Scatterplots
Students identify how to use a scatterplot to compare two sets of data to determine if they are related. Then they identify and describe the definition of regression line (the "line of best fit"). Students also identify how scientists...
Curated OER
Curve Sketching
In this calculus worksheet, students sketch a curve using a given function. They take the derivative of a function and graph it. There are 10 questions.
Math Mammoth
Slope; Math Mammoth.com
For this math activity, students find the slope of four lines when they are drawn on a coordinate grid. Students are given the slope and draw the line for two lines. They use the slope formula to find slope when given two points on a...
Creative Chemistry
A Simple Thermoetric Titration
In this thermometric titration activity, learners investigate the temperature changes when an acid neutralizes an alkali. High schoolers graph their results from the titration and draw the two best-fit lines on their graph. Where the...
Curated OER
Graphing Integers On a Coordinate Plane
Seventh graders explore the concept of graphing integers on a coordinate plane. In this graphing integers on a coordinate plane lesson plan, 7th graders discuss scenarios where coordinate systems are used in real life. Students...
Curated OER
Simultaneous Equations for Circuit Analysis
In this worksheet, students use Algebra to plot different solutions to equations and analyze schematics in order to answer a series of 25 open-ended questions about electrical circuits. This worksheet is printable and the answers are...
Sri Atmananda Memorial School
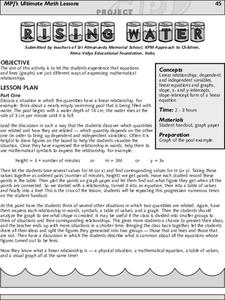
Rising Water
An engaging, and not to mention attractive, lesson plan has prealgebra and beginning algebra scholars examining linear relationships. They consider the rising water level as a swimming pool is being filled. They do so by charting and...
Curated OER
Linear and Exponential Functions
This comprehensive unit on linear and exponential functions provides numerous clearly-written worksheets. Topics include graphing linear equations, solving systems of equations algebraically and by graphing, identifying the domain and...
Curated OER
What's Your Shoe Size? Linear Regression with MS Excel
Learners collect and analyze data. In this statistics lesson, pupils create a liner model of their data and analyze it using central tendencies. They find the linear regression using a spreadsheet.
National Museum of Nuclear Science & History
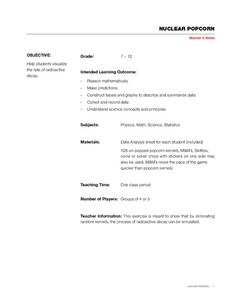
Nuclear Popcorn
Make your lesson on radioactive decay pop with this lab exercise. Using popcorn kernels spread over a tabletop, participants pick up all of those that point toward the back of the room, that is, those that represent decayed atoms. As the...
Curated OER
Measures of Central Tendency
In this measures of central tendency worksheet, learners find the mean, median, and mode of 9 problems given different data sets. Students then solve 2 word problems.
Curated OER
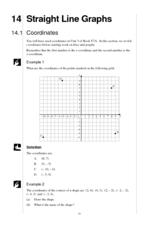
Straight Graph Lines: Coordinates
Students access prior knowledge of coordinates. In this coordinates lesson, students graph coordinate points to create a symmetrical figure and of a straight line. Students complete several practice examples.
Curated OER
Graph of the Tangent, cotangent, Secant, and Cosecant Functions
In this college level Pre-calculus worksheet, students examine the graphs of the Tangent, cotangent, secant, and cosecant functions. Students find the intercepts and any asymptotes. The seven page worksheet contains...
Curated OER
Fishing for Points TI-83/83 Plus
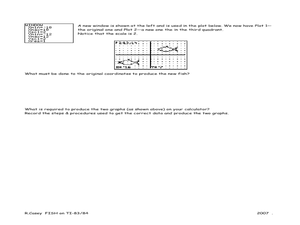
Ninth graders investigate the Cartesian coordinate plane. In this Algebra I lesson, 9th graders explore the coordinates of a drawing of a fish and examine the effects of moving the drawing on the ordered pairs. Students predict the...
Curated OER
Getting A Grip On Graphs
Fourth graders investigate the concept of graphing and comparing different types of data using pictographs, line graphs, scatter plots, etc... They gather data and make interpretations while examining the medium of how it is displayed.
Curated OER
Scatterplots
In this scatterplots worksheet, 9th graders solve 18 different types of problems related to scatterplots. First, they represent a two numerical variable on a scatterplot and describe how the data points are distributed. Then, students...
Curated OER
Graphing Polar Equations
In this graphing polar equations worksheet, students solve and complete 10 various types of problems. First, they construct a table of values using the special angles and their multiples. Then, students plot the points in the table on a...
Curated OER
MOVING IN TWO DIMENSIONS (GRAPHING)
In this graphing activity, students are asked to graph a "sketch" of a path walked by a student. Directions E, W, N and S are used. Students are given 8 graphs to complete and are then asked to evaluate their findings.
Curated OER
Graphing Points Worksheet
In this graphing points worksheet, learners plot ordered pairs on a coordinate plane. They graph 20 given problems, with 10 problems requiring students to graph two or more points.
Curated OER
Measurement and the Illampi Mound Colony
Students comprehend the basic units of measurement, scale, plotting, and basic grids. Students practice their estimation
and measuring skills and will demonstrate their ability to work well in groups.
Willow Tree
Midpoint and Distance Formulas
The shortest distance between two points is a straight line. Learners use the Pythagorean Theorem to develop a formula to find that distance. They then find the midpoint using an average formula.

