West Contra Costa Unified School District
Families of Functions Sort
Have some fun with functions with a short activity that asks learners to first sort scatter plot in terms of their correlation. They then sort graphs of different types of functions in terms of key features, such as slope.
Houghton Mifflin Harcourt
Surprise!: Extra Support Lessons (Theme 2)
Surprise! is the theme of a unit covering such topics as consonants, blending, short vowels sounds, high frequency words, and number words. The unit's lessons also include teachable moments covering story structure, illustrations,...
Curated OER
Identify and Graph Linear Equations
Students investigate linear functions. In this mathematics lesson, students plot points onto a graph by solving the equations y=x and y=mx+b by being given numbers for x and solving for y.
Curated OER
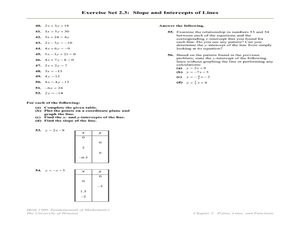
Slope, Intercepts, and Graphing a Line
In this intercepts and slope worksheet, young scholars find the slope and/or the x and y-intercepts in fifty-three problems. Students also graph lines using the x and y-intercepts.
Saxon
Plotting Functions
Youngsters use a graphing calculator to assist in creating a function table. They graph the function on a coordinate plane. They explore the relationship between the domain and range in the graph. This four-page worksheet contains two...
Curated OER
Scatter Diagrams and Curve Fitting
In this Scatter Diagrams and Curve Fitting worksheet, students are guided in how to graph a scatter diagram (plot) and a Best Fit Line using a TI-83 graphing calculator.
Curated OER
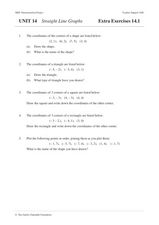
Straight Line Graphs
In this math instructional activity, students plot lines on a graph paper when given the equation for the line in slope-intercept form. They tell the values of the slope and the y-intercept. Students find the x and y intercepts and plot...
Curated OER
Best Guesser
Fifth graders develop strategies for estimating ages, and illustrate results by graphing and interpreting scatter plots to compare x and y coordinates.
Curated OER
Coordinates
In this geometry instructional activity, 10th graders are given points on a coordinate plane, and they must figure out what the x and y values are. There are 6 graphing question.
Curated OER
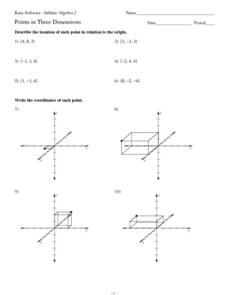
Points in Three Dimensions
In this plotting points worksheet, students plot 18 points in the 3-D plane. Students plot points on a graph given a point.
Curated OER
Equation of a Line
In this equation of a line worksheet, 9th graders solve and complete 4 different multiple choice problems. First, they use the median fit method to determine the equation that most likely represents the line of best fit for the data...
Curated OER
Statistics
In this statistics worksheet, students view 6 graphs to determine the correlation. Students then answer 4 questions that involve plotting data, determining a relationship, and making predictions.
Curated OER
Additional Practice Problems with Skills for Quadratic Functions and Equations
Challenge your students' graphing and factoring skills with these sets of problems for quadratic functions and equations. Here, students plot the y-intercept and vertex of 7 parabolas. They factor and solve 9 quadratic equations....
Curated OER
Graphing on a Coordinate Plane
Eighth graders explore the coordinate system. They identify the x and y-axis, parts of the coordinate plane, and discuss the process of plotting points. To emphasize the process of plotting points, 8th graders play an ordered pair...
Curated OER
Properties of Logarithms
Students explore the concept of logarithms. In this logarithms instructional activity, students graph logarithms on their Ti-Nspire calculator. Students describe the shapes of their graphs by identifying slope, y-intercepts, and...
Curated OER
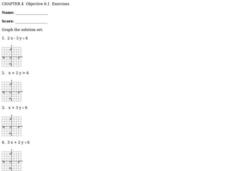
Graphing Inequalities
In this graphing inequalities worksheet, students solve and graph the solution set for eight inequalities. They first solve each inequality, either for x or for y, then they plot the coordinates found on the graph provided for each...
Curated OER
Creating Line Graphs
Students relate data to coordinate graphs and plot points on this graph. They use minimum wage data to construct the graph. Students decide appropriate time intervals for the graphs. They share graphs with their classmates.
Curated OER
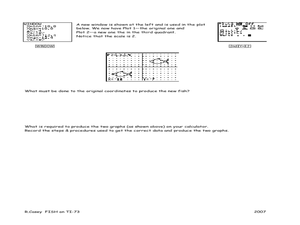
Fishing for Points
Learners explore the concept of ordered pairs. In this ordered pairs lesson plan, pupils list the ordered pairs of a graph in the shape of a fish. They use their calculator to translate the fish using lists, then translate the fish left,...
Curated OER
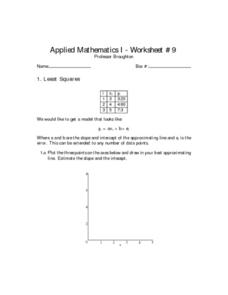
Least Squares
In this least squares worksheet, students solve 6 different problems that include the least squares of numbers. First, they plot 3 points on the axes shown and draw in their best approximating line. Then, students estimate the slope and...
Curated OER
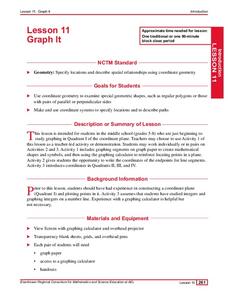
Graph It
Elementary and middle schoolers engage in a lesson of graphing in quadrant I of the coordinate plain. They use the graph to create shapes and symbols. While using a graphing calculator, they locate the points on the coordinate plane. In...
Curated OER
Points In the X-Y Plane
Students plot points on the x-y plane using x and y coordinates and describe how the x and y values relate to the position of the point on the plane. They plot points that fit a linear relationship. They explain that their horizontal and...
Curated OER
Points in the X-Y Plane
Students plot points on the x-y plane using x and y coordinates. They describe how the x and y values relate to the position of the point on the plane. Finally, students plot points that fit a linear relationship and summarize that a...
Curated OER
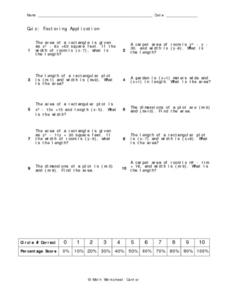
Factoring Application
In this factoring application activity, 9th graders solve 10 different problem related to various factoring applications. First, they determine the length of a room given the area of a rectangle and square footage. Then, students...
Curated OER
Integration: Statistics, Scatter Plots and Best-Fit Lines
In this math worksheet, students identify the type (if any) of correlation on 6 scatter plots. They use information given on a table to create a scatter plot and identify the type of correlation. Students use the scatter plot to make...


